- Beaumont, Knoxville homes for sale
- Colonial Village, Knoxville homes for sale
- Downtown, Knoxville homes for sale
- Forest Heights, Knoxville homes for sale
- Fort Sanders, Knoxville homes for sale
- Fourth & Gill, Knoxville homes for sale
- Lakemoor Hills, Knoxville homes for sale
- Mechanicsville, Knoxville homes for sale
- Morningside, Knoxville homes for sale
- Old City, Knoxville homes for sale
- Old Sevier, Knoxville homes for sale
- Sequoyah Hills, Knoxville homes for sale
- South Knoxville, Knoxville homes for sale
- Top of the World, Tallassee homes for sale
- University of Tennessee, Knoxville homes for sale
- Vestal, Knoxville homes for sale
- West Hills, Knoxville homes for sale
- West Knoxville, Knoxville homes for sale
- West View, Knoxville homes for sale
- WindRiver, Lenoir City homes for sale
Maryville, TN - homes for sale
269 of 269 results displayed
- New
 $418,000Active4 beds 3 baths1,997 sq. ft.
3643 Crimson Circle, Maryville, TN 37801
MLS# 1331875Listed by: KELLER WILLIAMS REALTY - New
 $369,900Active2 beds 2 baths1,365 sq. ft.
2008 Cochran Place, Maryville, TN 37803
MLS# 1331867Listed by: REALTY EXECUTIVES ASSOCIATES - New
 $450,000Active2 beds 2 baths1,642 sq. ft.
1209 Branch Creek Lane, Maryville, TN 37801
MLS# 1331851Listed by: DELOZIER REALTY & AUCTION - New
 $211,000Active3 beds 1 baths1,056 sq. ft.
1102 Brookside Ave, Maryville, TN 37804
MLS# 1331710Listed by: KING REAL ESTATE SERVICES,INC - New
 $299,000Active3 beds 1 baths1,008 sq. ft.
728 Black Forest Drive, Maryville, TN 37801
MLS# 1331683Listed by: REALTY EXECUTIVES ASSOCIATES - New

 $489,900Active3 beds 2 baths2,425 sq. ft.
409 Lambert Lane, Maryville, TN 37803
MLS# 1331629Listed by: CENTURY 21 LEGACY - New
 $364,900Active3 beds 2 baths1,349 sq. ft.
437 Asher Way, Maryville, TN 37803
MLS# 1331632Listed by: CENTURY 21 LEGACY - New
 $230,000Active2 beds 1 baths804 sq. ft.
404 N 5th St, Maryville, TN 37804
MLS# 1331592Listed by: TOWN & COUNTRY - REALTORS OF EAST TN, INC. - New
 $365,000Active3 beds 2 baths1,675 sq. ft.
3705 Melissa Lane, Maryville, TN 37801
MLS# 1331563Listed by: REMAX FIRST  $389,000Pending3 beds 2 baths1,661 sq. ft.
910 Thunder Creek Drive, Maryville, TN 37801
MLS# 1331548Listed by: REALTY EXECUTIVES ASSOCIATES- New
 $269,000Active2 beds 3 baths1,443 sq. ft.
838 Railroad St, Maryville, TN 37804
MLS# 1331442Listed by: LECONTE REALTY, LLC - New
 $289,000Active2 beds 1 baths866 sq. ft.
503 Elmira Lane, Maryville, TN 37804
MLS# 1331487Listed by: ALLIANCE SOTHEBY'S INTERNATIONAL - New
 $899,000Active5 beds 6 baths5,138 sq. ft.
1245 S Heritage Drive, Maryville, TN 37803
MLS# 1331429Listed by: MR10 REALTY - New
 $664,900Active4 beds 3 baths2,982 sq. ft.
108 Broady Meadow Circle, Maryville, TN 37803
MLS# 1331391Listed by: REAL BROKER - New
 $750,000Active4 beds 4 baths3,202 sq. ft.
1706 Inverness Drive, Maryville, TN 37801
MLS# 1331392Listed by: REALTY EXECUTIVES ASSOCIATES  $334,900Pending3 beds 2 baths1,403 sq. ft.
2105 Autumn Oak Circle, Maryville, TN 37801
MLS# 1331367Listed by: REALTY EXECUTIVES ASSOCIATES- New
 $435,000Active3 beds 3 baths2,259 sq. ft.
3203 Song Sparrow Drive, Maryville, TN 37803
MLS# 1331371Listed by: SOUTHLAND REALTORS, INC  $365,000Pending3 beds 2 baths1,818 sq. ft.
921 Portsmouth Circle, Maryville, TN 37803
MLS# 1331316Listed by: REALTY EXECUTIVES ASSOCIATES $329,900Pending3 beds 1 baths1,092 sq. ft.
1518 Irwin Ave, Maryville, TN 37804
MLS# 1331268Listed by: TENNESSEE LIFE REAL ESTATE PROFESSIONALS $365,000Pending3 beds 3 baths1,850 sq. ft.
1719 Bennett Village Drive, Maryville, TN 37804
MLS# 1331251Listed by: WOODY CREEK REALTY, LLC- New
 $429,900Active4 beds 2 baths1,774 sq. ft.
125 Colts Tr, Maryville, TN 37803
MLS# 1331241Listed by: LECONTE REALTY, LLC  $595,000Pending3 beds 2 baths2,037 sq. ft.
1408 Cottage Glen Lane, Maryville, TN 37801
MLS# 1331190Listed by: THE DWIGHT PRICE GROUP REALTY EXECUTIVES ASSOCIATES- New
 $365,000Active3 beds 2 baths1,489 sq. ft.
1808 E Alpine Drive, Maryville, TN 37804
MLS# 1331147Listed by: UNITED REAL ESTATE SOLUTIONS - New
 $419,000Active3 beds 2 baths1,557 sq. ft.
2940 Parkview Drive, Maryville, TN 37803
MLS# 3137724Listed by: REALTY EXECUTIVES ASSOCIATES - New
 $319,900Active2 beds 2 baths1,184 sq. ft.
2023 Cochran Place, Maryville, TN 37803
MLS# 1331106Listed by: REALTY EXECUTIVES ASSOCIATES - New
 $595,000Active4 beds 2 baths2,594 sq. ft.
615 S Washington St, Maryville, TN 37804
MLS# 1331065Listed by: WALLACE NELSON REAL ESTATE - Open Sat, 6 to 8:30pmNew
 $560,000Active5 beds 4 baths2,679 sq. ft.
507 Rule St, Maryville, TN 37804
MLS# 1330989Listed by: REALTY EXECUTIVES ASSOCIATES  $379,900Pending3 beds 3 baths2,562 sq. ft.
815 Stetson Drive, Maryville, TN 37801
MLS# 1330957Listed by: REALTY EXECUTIVES ASSOCIATES- New
 $499,900Active4 beds 3 baths2,772 sq. ft.
1410 Carowinds Circle, Maryville, TN 37803
MLS# 1330939Listed by: THE DWIGHT PRICE GROUP REALTY EXECUTIVES ASSOCIATES  $409,900Pending3 beds 2 baths1,724 sq. ft.
216 Clover Meadow Lane, Maryville, TN 37801
MLS# 1330922Listed by: REALTY EXECUTIVES ASSOCIATES $379,000Pending4 beds 3 baths1,700 sq. ft.
217 Waller Ave, Maryville, TN 37803
MLS# 1330908Listed by: CAPSTONE REALTY GROUP- New
 $649,900Active5 beds 3 baths3,305 sq. ft.
209 Montgomery Lane, Maryville, TN 37803
MLS# 1330901Listed by: REALTY EXECUTIVES ASSOCIATES - New
 $514,000Active4 beds 2 baths2,197 sq. ft.
1503 Roxy Lane, Maryville, TN 37803
MLS# 1330878Listed by: UNITED REAL ESTATE SOLUTIONS - New
 $345,000Active4 beds 2 baths1,400 sq. ft.
241 Boardman Ave, Maryville, TN 37803
MLS# 1330768Listed by: REALTY EXECUTIVES ASSOCIATES  $520,000Pending4 beds 4 baths2,904 sq. ft.
1206 Oak Park Ave, Maryville, TN 37803
MLS# 1330785Listed by: REMAX FIRST- New
 $420,000Active3 beds 2 baths1,491 sq. ft.
5823 Old Niles Ferry Pike, Maryville, TN 37801
MLS# 1330696Listed by: HOME AND FARMS REALTY  $240,000Pending2.7 Acres
2919 E Lamar Alexander Pkwy, Maryville, TN 37804
MLS# 1330666Listed by: REALTY EXECUTIVES ASSOCIATES- New
 $629,900Active3 beds 2 baths2,283 sq. ft.
2925 Marvin Circle, Maryville, TN 37803
MLS# 1330630Listed by: REALTY EXECUTIVES ASSOCIATES  $499,900Pending4 beds 3 baths2,254 sq. ft.
1034 Wilder Chapel Lane, Maryville, TN 37804
MLS# 1330540Listed by: REALTY EXECUTIVES ASSOCIATES $339,900Active2 beds 8 baths1,273 sq. ft.
1231 Karina Circle, Maryville, TN 37804
MLS# 1330551Listed by: VANGUARD REALTY, INC. $650,000Pending4 beds 3 baths2,764 sq. ft.
293 Savannah Park Drive, Maryville, TN 37803
MLS# 1330526Listed by: KELLER WILLIAMS $899,900Active4 beds 4 baths2,855 sq. ft.
244 Savannah Park Drive, Maryville, TN 37803
MLS# 1330504Listed by: THE PRICE AGENCY, REALTY EXECUTIVES $299,900Active2 beds 2 baths1,238 sq. ft.
411 Regal Tower #411, Maryville, TN 37804
MLS# 3072024Listed by: REALTY EXECUTIVES ASSOCIATES $399,000Active3 beds 3 baths2,085 sq. ft.
4111 Legends Way, Maryville, TN 37801
MLS# 1330443Listed by: REALTY EXECUTIVES ASSOCIATES $819,900Active5 beds 3 baths2,987 sq. ft.
427 Royal Oaks Drive, Maryville, TN 37801
MLS# 1330392Listed by: REALTY EXECUTIVES ASSOCIATES $235,000Pending2 beds 1 baths1,015 sq. ft.
705 S Everett High Rd, Maryville, TN 37804
MLS# 1330360Listed by: THE FERGUSON COMPANY- Open Mon, 5 to 9pm
 $303,000Active3 beds 3 baths1,471 sq. ft.
1715 Bennett Village Drive, Maryville, TN 37804
MLS# 1330347Listed by: WOODY CREEK REALTY, LLC  $669,900Active4 beds 3 baths3,000 sq. ft.
295 Savannah Park Drive, Maryville, TN 37803
MLS# 1330259Listed by: WALLACE NELSON REAL ESTATE $624,900Active5 beds 3 baths2,606 sq. ft.
409 Belle Meade Drive, Maryville, TN 37803
MLS# 1330218Listed by: LECONTE REALTY, LLC $229,900Pending3 beds 2 baths1,344 sq. ft.
2802 New Blockhouse Rd, Maryville, TN 37803
MLS# 1330223Listed by: ASSET REALTY MANAGEMENT, INC. $380,000Pending3 beds 3 baths2,066 sq. ft.
1606 Sunrise Drive, Maryville, TN 37803
MLS# 1330200Listed by: LPT REALTY, LLC $279,900Active2 beds 3 baths1,336 sq. ft.
771 Casey Lane, Maryville, TN 37801
MLS# 1330138Listed by: REALTY EXECUTIVES ASSOCIATES $537,500Active4 beds 3 baths3,200 sq. ft.
1421 Cedar Park Drive, Maryville, TN 37803
MLS# 1330110Listed by: REALTY EXECUTIVES ASSOCIATES $550,000Active4 beds 3 baths2,518 sq. ft.
2320 Portland Drive, Maryville, TN 37803
MLS# 1330019Listed by: REALTY EXECUTIVES ASSOCIATES $499,900Pending3 beds 2 baths1,930 sq. ft.
2103 Chesterfield Drive, Maryville, TN 37803
MLS# 1330020Listed by: REALTY EXECUTIVES ASSOCIATES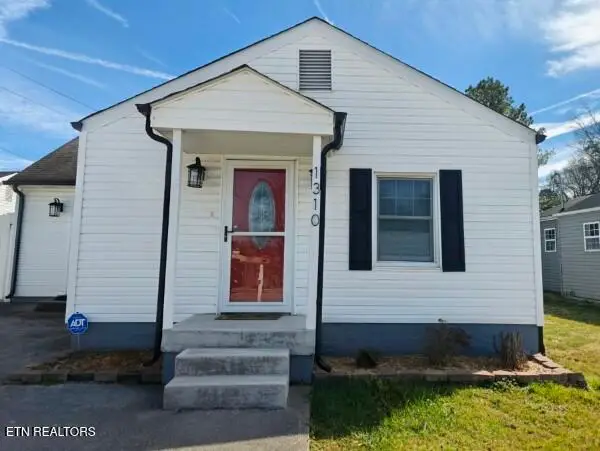 $308,000Active2 beds 2 baths857 sq. ft.
1310 Madison Ave, Maryville, TN 37804
MLS# 1329988Listed by: LAKEFRONT LIVING, ON THE LAKE $174,500Active1.32 Acres
3126 Davis Ford Rd, Maryville, TN 37804
MLS# 1329989Listed by: BLEVINS GRP, REALTY EXECUTIVES $998,000Active6 beds 5 baths4,298 sq. ft.
420 Holland Springs Drive, Maryville, TN 37803
MLS# 1329976Listed by: REALTY EXECUTIVES ASSOCIATES $528,478Active3 beds 3 baths2,363 sq. ft.
1997 Lovingwood Springs Tr #2, Maryville, TN 37803
MLS# 1329953Listed by: KELLER WILLIAMS SIGNATURE $299,900Pending3 beds 3 baths1,471 sq. ft.
1721 Bennett Village Drive, Maryville, TN 37804
MLS# 1329920Listed by: WOODY CREEK REALTY, LLC $315,000Pending3 beds 2 baths1,216 sq. ft.
2411 Montvale Rd, Maryville, TN 37803
MLS# 1329902Listed by: CAPSTONE REALTY GROUP $499,900Active3 beds 3 baths1,972 sq. ft.
3137 Reiley Drive, Maryville, TN 37801
MLS# 1329872Listed by: BLEVINS GRP, REALTY EXECUTIVES $260,500Pending3 beds 2 baths1,098 sq. ft.
513 Amerine Road, Maryville, TN 37804
MLS# 1528771Listed by: REALTY ONE GROUP EXPERTS $990,000Active-- beds -- baths7,608 sq. ft.
301 S Magnolia St, Maryville, TN 37803
MLS# 1329795Listed by: PWA PROPERTIES $389,000Active3 beds 3 baths1,915 sq. ft.
719 Haig St, Maryville, TN 37801
MLS# 1329781Listed by: REALTY EXECUTIVES ASSOCIATES $389,000Active3 beds 3 baths1,915 sq. ft.
721 Haig St, Maryville, TN 37801
MLS# 1329782Listed by: REALTY EXECUTIVES ASSOCIATES $399,000Active3 beds 3 baths1,915 sq. ft.
723 Haig St, Maryville, TN 37801
MLS# 1329783Listed by: REALTY EXECUTIVES ASSOCIATES $615,000Pending3 beds 3 baths2,600 sq. ft.
1836 Westcliff Drive, Maryville, TN 37803
MLS# 1329747Listed by: REALTY EXECUTIVES ASSOCIATES $305,000Pending5 beds 1 baths1,558 sq. ft.
200 N 5th St, Maryville, TN 37804
MLS# 1329581Listed by: MAX HOUSE BROKERED EXP $399,000Pending3 beds 2 baths2,106 sq. ft.
214 Royal Oaks Dr. Drive, Maryville, TN 37801
MLS# 1329535Listed by: PRIME MOUNTAIN PROPERTIES- Open Mon, 5 to 9pm
 $365,000Active3 beds 3 baths1,850 sq. ft.
1820 Bennett Village Drive, Maryville, TN 37804
MLS# 1329502Listed by: WOODY CREEK REALTY, LLC  $450,000Active3 beds 3 baths2,412 sq. ft.
309 Caboose Lane, Maryville, TN 37804
MLS# 1329484Listed by: REALTY EXECUTIVES ASSOCIATES $574,900Active3 beds 2 baths1,600 sq. ft.
lot 4 Stone Lane, Maryville, TN 37801
MLS# 1329441Listed by: REALTY EXECUTIVES ASSOCIATES $749,500Pending4 beds 4 baths3,391 sq. ft.
807 Brookwood Lane, Maryville, TN 37801
MLS# 1329431Listed by: REALTY EXECUTIVES ASSOCIATES $310,000Pending3 beds 2 baths1,196 sq. ft.
1115 Fielding Drive, Maryville, TN 37804
MLS# 1329413Listed by: REMAX FIRST $314,999Active3 beds 2 baths1,189 sq. ft.
1407 Wales Ave, Maryville, TN 37804
MLS# 1329350Listed by: LITTLE RIVER REALTY $432,500Active4 beds 2 baths2,015 sq. ft.
343 Royal Oaks Drive, Maryville, TN 37801
MLS# 1329314Listed by: CAPSTONE REALTY GROUP $585,000Active5 beds 4 baths3,196 sq. ft.
1037 Ruscello Drive, Maryville, TN 37801
MLS# 3128536Listed by: WALLACE-JENNIFER SCATES GROUP $750,000Active4 beds 3 baths2,564 sq. ft.
1846 Southcliff Drive, Maryville, TN 37803
MLS# 1329152Listed by: KELLER WILLIAMS REALTY $319,900Active3 beds 2 baths1,444 sq. ft.
508 S Ruth St, Maryville, TN 37803
MLS# 1329096Listed by: REMAX FIRST $295,000Active2 beds 2 baths1,238 sq. ft.
504 Regal Tower, Maryville, TN 37804
MLS# 3124539Listed by: UNITED REAL ESTATE SOLUTIONS $415,000Active1 beds 1 baths980 sq. ft.
2036 Morganton Rd, Maryville, TN 37801
MLS# 1329033Listed by: LECONTE REALTY, LLC $395,000Pending3 beds 3 baths2,663 sq. ft.
1014 Kensington Blvd, Maryville, TN 37803
MLS# 1329022Listed by: REALTY EXECUTIVES ASSOCIATES $289,000Active4 beds 2 baths1,556 sq. ft.
2001 Lacy Ln, Maryville, TN 37801
MLS# 3127689Listed by: REZULTS REALTY, LLC $425,000Active3 beds 2 baths1,410 sq. ft.
2734 Greenway Drive, Maryville, TN 37803
MLS# 3123056Listed by: UNITED REAL ESTATE SOLUTIONS $599,000Active-- beds -- baths2,624 sq. ft.
129/131 Lucy Ln, Maryville, TN 37803
MLS# 1328681Listed by: KELLER WILLIAMS $599,000Active-- beds -- baths2,624 sq. ft.
129131 Lucy Ln, Maryville, TN 37803
MLS# 3122908Listed by: KELLER WILLIAMS $549,500Active3 beds 3 baths2,164 sq. ft.
841 Wilson Rd, Maryville, TN 37801
MLS# 1328623Listed by: WALLACE $244,900Pending3 beds 2 baths1,891 sq. ft.
1212 Woodlawn Ave, Maryville, TN 37804
MLS# 1328403Listed by: REALTY EXECUTIVES ASSOCIATES $275,000Pending4 beds 2 baths1,709 sq. ft.
2010 Swarthmore Lane, Maryville, TN 37804
MLS# 1328367Listed by: REALTY EXECUTIVES ASSOCIATES $379,000Pending4 beds 3 baths1,928 sq. ft.
419 Greencrest Drive, Maryville, TN 37803
MLS# 1328335Listed by: CAPSTONE REALTY GROUP $310,000Pending3 beds 2 baths1,353 sq. ft.
3021 Sam James Rd, Maryville, TN 37803
MLS# 1328264Listed by: MAX HOUSE BROKERED EXP $419,900Active4 beds 3 baths3,044 sq. ft.
2616 Best Rd, Maryville, TN 37803
MLS# 1328215Listed by: KELLER WILLIAMS REALTY $489,900Pending5 beds 3 baths2,619 sq. ft.
142 Eleanor Davis Drive, Maryville, TN 37804
MLS# 1328190Listed by: REALTY EXECUTIVES ASSOCIATES $449,500Pending3 beds 2 baths1,976 sq. ft.
1961 Emma Lane, Maryville, TN 37803
MLS# 1328160Listed by: BLEVINS GRP, REALTY EXECUTIVES $398,000Active2 beds 2 baths1,549 sq. ft.
921 Mercer Drive, Maryville, TN 37801
MLS# 3113393Listed by: WALLACE-JENNIFER SCATES GROUP $644,900Active4 beds 3 baths2,956 sq. ft.
2007 Logan Drive, Maryville, TN 37803
MLS# 1328054Listed by: REALTY EXECUTIVES ASSOCIATES $374,900Active3 beds 2 baths1,809 sq. ft.
318 Amerine Rd, Maryville, TN 37804
MLS# 1328024Listed by: BLEVINS GRP, REALTY EXECUTIVES $329,900Active2 beds 3 baths1,471 sq. ft.
1330 Mountain Quail Circle, Maryville, TN 37801
MLS# 3118360Listed by: KELLER WILLIAMS $399,999Active3 beds 2 baths1,592 sq. ft.
1035 Willow Creek Circle, Maryville, TN 37804
MLS# 1327984Listed by: RIVER ROCK REAL ESTATE GROUP $434,000Active3 beds 3 baths1,950 sq. ft.
749 Maple Grove St, Maryville, TN 37801
MLS# 1327932Listed by: REALTY EXECUTIVES ASSOCIATES $463,900Active3 beds 2 baths2,276 sq. ft.
2729 Old Niles Ferry-.9 Acres-lot 3 Rd, Maryville, TN 37803
MLS# 1327872Listed by: REALTY EXECUTIVES ASSOCIATES $309,000Active3 beds 3 baths1,471 sq. ft.
1720 Bennett Village Drive, Maryville, TN 37804
MLS# 1327663Listed by: WOODY CREEK REALTY, LLC $303,000Active3 beds 3 baths1,471 sq. ft.
1723 Bennett Village Drive, Maryville, TN 37804
MLS# 1327628Listed by: WOODY CREEK REALTY, LLC- Open Mon, 5 to 9pm
 $360,000Active3 beds 3 baths1,850 sq. ft.
1725 Bennett Village Drive, Maryville, TN 37804
MLS# 1327640Listed by: WOODY CREEK REALTY, LLC  $725,000Pending4 beds 4 baths2,937 sq. ft.
1619 Amhurst Lane, Maryville, TN 37801
MLS# 1327616Listed by: LECONTE REALTY, LLC $399,000Active3 beds 2 baths1,831 sq. ft.
2033 Cochran Place, Maryville, TN 37803
MLS# 1327595Listed by: THE PRICE AGENCY, REALTY EXECUTIVES $599,000Pending4 beds 3 baths2,717 sq. ft.
604 Branchwood Lane, Maryville, TN 37801
MLS# 1327592Listed by: REALTY EXECUTIVES ASSOCIATES $398,000Active2 beds 2 baths1,549 sq. ft.
921 Mercer Drive, Maryville, TN 37801
MLS# 1327579Listed by: WALLACE JENNIFER SCATES GROUP $315,000Active3 beds 1 baths1,372 sq. ft.
528 France Lane, Maryville, TN 37803
MLS# 1327528Listed by: REMAX FIRST $329,900Pending3 beds 2 baths1,348 sq. ft.
117 Linwood Lane, Maryville, TN 37804
MLS# 1327402Listed by: UNITED REAL ESTATE SOLUTIONS $578,478Pending3 beds 3 baths2,363 sq. ft.
1999 Lovingwood Springs Trail Tr, Maryville, TN 37803
MLS# 1327235Listed by: KELLER WILLIAMS SIGNATURE $247,500Pending2 beds 1 baths1,348 sq. ft.
1211 Foch St, Maryville, TN 37801
MLS# 1327134Listed by: WALLACE $399,900Active3 beds 3 baths1,860 sq. ft.
2018 Swarthmore Lane, Maryville, TN 37804
MLS# 1327111Listed by: DELOZIER REALTY & AUCTION $307,000Pending2 beds 3 baths1,471 sq. ft.
1728 Bennett Village Drive, Maryville, TN 37804
MLS# 1326969Listed by: WOODY CREEK REALTY, LLC $369,000Active3 beds 3 baths1,850 sq. ft.
1727 Bennett Village Drive, Maryville, TN 37804
MLS# 1326977Listed by: WOODY CREEK REALTY, LLC $250,000Pending2 beds 2 baths1,226 sq. ft.
1926 Sequoyah Ave, Maryville, TN 37804
MLS# 1326924Listed by: REALTY EXECUTIVES ASSOCIATES $389,900Active3 beds 2 baths1,778 sq. ft.
314 David Lane, Maryville, TN 37803
MLS# 1326809Listed by: REALTY EXECUTIVES ASSOCIATES $339,900Pending2 beds 2 baths1,300 sq. ft.
214 Waters Rd, Maryville, TN 37803
MLS# 1326895Listed by: REALTY EXECUTIVES ASSOCIATES $249,000Pending2 beds 1 baths1,053 sq. ft.
102 Pinedale St, Maryville, TN 37801
MLS# 1326759Listed by: REALTY EXECUTIVES ASSOCIATES $374,900Pending3.04 Acres
1231 Walker Road Rd, Maryville, TN 37801
MLS# 1326662Listed by: REALTY EXECUTIVES ASSOCIATES $314,000Pending2 beds 3 baths1,471 sq. ft.
1617 Bennett Village Drive, Maryville, TN 37804
MLS# 1326655Listed by: WOODY CREEK REALTY, LLC $50,000Pending0.9 Acres
Melissa Lane, Maryville, TN 37801
MLS# 1326595Listed by: WALLACE NELSON REAL ESTATE $130,000Pending2 beds 2 baths1,296 sq. ft.
2837 New Blockhouse Rd, Maryville, TN 37803
MLS# 1326567Listed by: CAPSTONE REALTY GROUP $524,900Pending3 beds 2 baths2,257 sq. ft.
1601 Northfield Drive, Maryville, TN 37804
MLS# 1326455Listed by: REMAX PREFERRED PROPERTIES, IN $495,000Active3 beds 2 baths2,371 sq. ft.
3866 Legends Way, Maryville, TN 37801
MLS# 1326374Listed by: REALTY EXECUTIVES ASSOCIATES $649,500Pending4 beds 2 baths2,900 sq. ft.
1915 Andy Lane, Maryville, TN 37803
MLS# 1326228Listed by: KELLER WILLIAMS $449,900Active4 beds 3 baths2,072 sq. ft.
321 Caboose Lane, Maryville, TN 37804
MLS# 1326073Listed by: REALTY EXECUTIVES ASSOCIATES $490,000Pending3 beds 2 baths1,814 sq. ft.
1004 Laurie St, Maryville, TN 37803
MLS# 1326029Listed by: REALTY EXECUTIVES ASSOCIATES $319,900Pending2 beds 2 baths1,320 sq. ft.
2028 Cochran Place, Maryville, TN 37803
MLS# 1325878Listed by: REALTY EXECUTIVES ASSOCIATES $415,000Active3 beds 3 baths2,260 sq. ft.
313 Holliwell Chase Lane, Maryville, TN 37804
MLS# 1325754Listed by: CASTILLO REALTY $885,000Active4 beds 3 baths3,772 sq. ft.
903 S Court St, Maryville, TN 37803
MLS# 3073567Listed by: KELLER WILLIAMS $340,000Active3 beds 2 baths1,528 sq. ft.
2207 Tuckaleechee Pike, Maryville, TN 37803
MLS# 3073108Listed by: WALLACE $474,000Active3 beds 3 baths3,358 sq. ft.
1203 Clendenen Rd, Maryville, TN 37801
MLS# 1325488Listed by: BRICK & MORTAR PROPERTIES, LLC $359,999Active2 beds 2 baths1,496 sq. ft.
1733 S Odell Rd, Maryville, TN 37801
MLS# 1325484Listed by: TENNESSEE MOUNTAIN REAL ESTATE $421,250Active3 beds 2 baths1,304 sq. ft.
431 Kingsley Court, Maryville, TN 37804
MLS# 1325469Listed by: ENGEL & VOLKERS KNOXVILLE $349,900Pending4 beds 3 baths2,770 sq. ft.
3018 Rambling Rd, Maryville, TN 37801
MLS# 1325389Listed by: REALTY EXECUTIVES ASSOCIATES- Open Mon, 5 to 9pm
 $309,000Active3 beds 3 baths1,471 sq. ft.
1718 Bennett Village Drive, Maryville, TN 37804
MLS# 1325305Listed by: WOODY CREEK REALTY, LLC  $339,900Active3 beds 2 baths1,286 sq. ft.
2919 Montvale Rd, Maryville, TN 37803
MLS# 1325311Listed by: KELLER WILLIAMS $392,500Pending3 beds 2 baths1,750 sq. ft.
3002 Country Meadows Lane, Maryville, TN 37803
MLS# 1325237Listed by: REALTY EXECUTIVES ASSOCIATES $830,000Pending3 beds 3 baths4,124 sq. ft.
1006 Foxdale Drive, Maryville, TN 37803
MLS# 1325187Listed by: CRYE-LEIKE REALTORS, TELLICO VILLAGE $479,900Active3 beds 2 baths2,408 sq. ft.
2913 Old Niles Ferry Rd, Maryville, TN 37803
MLS# 1325128Listed by: REALTY EXECUTIVES ASSOCIATES $399,900Pending4 beds 3 baths2,660 sq. ft.
158 Sunset View Loop, Maryville, TN 37801
MLS# 1325042Listed by: LECONTE REALTY, LLC $400,000Pending-- beds -- baths4,914 sq. ft.
324-330 Cunningham St, Maryville, TN 37803
MLS# 1325025Listed by: HUSTLE REALTY- Open Mon, 5 to 9pm
 $368,900Active3 beds 3 baths1,850 sq. ft.
1737 Bennett Village Drive, Maryville, TN 37804
MLS# 1325009Listed by: WOODY CREEK REALTY, LLC  $699,900Active4 beds 4 baths3,436 sq. ft.
704 Knights Bridge Rd, Maryville, TN 37803
MLS# 1324605Listed by: THE DWIGHT PRICE GROUP REALTY EXECUTIVES ASSOCIATES $519,900Active4 beds 3 baths2,574 sq. ft.
133 Chelsea Lane, Maryville, TN 37803
MLS# 1324581Listed by: THE PRICE AGENCY, REALTY EXECUTIVES $415,000Pending4 beds 3 baths2,224 sq. ft.
1012 Kensington Blvd, Maryville, TN 37803
MLS# 1324588Listed by: OPENDOOR BROKERAGE, LLC $464,500Pending3 beds 2 baths1,710 sq. ft.
258 Sand Hills Drive, Maryville, TN 37801
MLS# 1324344Listed by: THE DWIGHT PRICE GROUP REALTY EXECUTIVES ASSOCIATES $249,000Pending3 beds 1 baths1,010 sq. ft.
602 Mcginley St, Maryville, TN 37804
MLS# 1324087Listed by: REALTY EXECUTIVES ASSOCIATES $453,383Active5 beds 3 baths2,495 sq. ft.
3506 Crimson Circle, Maryville, TN 37801
MLS# 1323784Listed by: REALTY EXECUTIVES ASSOCIATES $354,900Active3 beds 2 baths1,575 sq. ft.
1202 Tapoco Ave, Maryville, TN 37801
MLS# 1323766Listed by: REALTY EXECUTIVES ASSOCIATES $595,000Pending4 beds 3 baths2,926 sq. ft.
1559 Crestridge Drive, Maryville, TN 37804
MLS# 1323723Listed by: HONEYCOMB REALTY, LLC $320,000Active3 beds 2 baths1,632 sq. ft.
807 Lafollette Dr Drive, Maryville, TN 37801
MLS# 1323691Listed by: SUNDOWN REALTY, INC. $99,500Active0.33 Acres
1012 Saint Johns Dr, Maryville, TN 37801
MLS# 3057900Listed by: BENCHMARK REALTY, LLC $545,000Active4 beds 3 baths2,529 sq. ft.
2241 Argonne Drive, Maryville, TN 37804
MLS# 1323360Listed by: TOWN & COUNTRY - REALTORS OF EAST TN, INC. $489,000Pending4 beds 2 baths1,932 sq. ft.
1213 N Wingate Way, Maryville, TN 37803
MLS# 1323188Listed by: REALTY EXECUTIVES ASSOCIATES $374,900Pending4 beds 2 baths1,998 sq. ft.
110 Ken Lewis Way, Maryville, TN 37801
MLS# 1323159Listed by: REALTY EXECUTIVES ASSOCIATES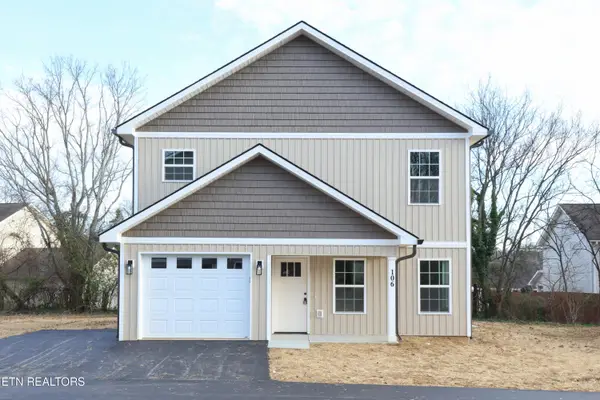 $349,900Pending5 beds 2 baths1,767 sq. ft.
106 Ken Lewis Way, Maryville, TN 37801
MLS# 1323154Listed by: REALTY EXECUTIVES ASSOCIATES $336,900Pending3 beds 2 baths1,398 sq. ft.
1321 Tapoco Ave, Maryville, TN 37801
MLS# 1323117Listed by: REALTY EXECUTIVES ASSOCIATES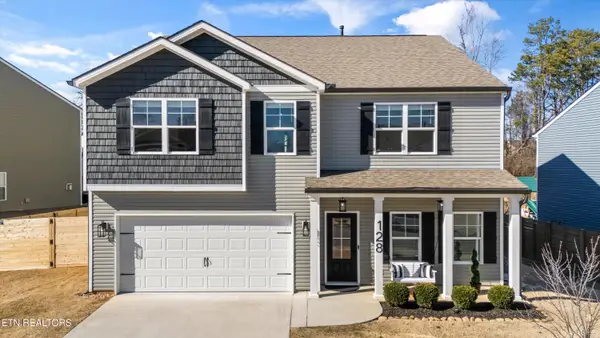 $514,999Pending4 beds 3 baths2,925 sq. ft.
128 Canton Lane, Maryville, TN 37803
MLS# 1323089Listed by: WALLACE $379,900Active4 beds 2 baths2,225 sq. ft.
1624 Everett Ave, Maryville, TN 37804
MLS# 1323074Listed by: REALTY EXECUTIVES ASSOCIATES $410,325Pending5 beds 3 baths2,511 sq. ft.
1351 Three Horses Lane, Maryville, TN 37803
MLS# 1322994Listed by: D.R. HORTON $625,000Active3 beds 3 baths3,047 sq. ft.
1403 Lincolnshire Drive, Maryville, TN 37803
MLS# 1322989Listed by: THE DWIGHT PRICE GROUP REALTY EXECUTIVES ASSOCIATES $386,255Pending3 beds 3 baths2,164 sq. ft.
1349 Three Horses Lane, Maryville, TN 37803
MLS# 1322992Listed by: D.R. HORTON $416,320Pending5 beds 4 baths2,618 sq. ft.
1353 Three Horses Lane, Maryville, TN 37803
MLS# 1322993Listed by: D.R. HORTON $340,000Active4 beds 2 baths1,607 sq. ft.
108 Seminole Drive, Maryville, TN 37804
MLS# 1322908Listed by: EXIT TLC REALTY $199,900Pending0.91 Acres
227 Emma Ross Lane, Maryville, TN 37803
MLS# 1322891Listed by: REALTY EXECUTIVES ASSOCIATES $397,000Pending3 beds 3 baths2,175 sq. ft.
1711 Newbury Lane, Maryville, TN 37803
MLS# 1322797Listed by: REALTY EXECUTIVES ASSOCIATES $495,000Active4 beds 3 baths2,252 sq. ft.
2527 Brantley Park Blvd, Maryville, TN 37804
MLS# 1322777Listed by: CENTURY 21 LEGACY $369,885Active3 beds 3 baths1,645 sq. ft.
1359 Three Horses Lane, Maryville, TN 37803
MLS# 1322441Listed by: D.R. HORTON $370,410Pending3 beds 2 baths1,618 sq. ft.
1355 Three Horses Lane, Maryville, TN 37803
MLS# 1322389Listed by: D.R. HORTON $459,000Pending3 beds 4 baths2,446 sq. ft.
732 Echo Hill Way, Maryville, TN 37801
MLS# 1321736Listed by: WALLACE NELSON REAL ESTATE $376,275Pending3 beds 3 baths1,850 sq. ft.
1605 Bennett Village Drive, Maryville, TN 37804
MLS# 1316811Listed by: WOODY CREEK REALTY, LLC $376,875Pending3 beds 3 baths1,850 sq. ft.
1608 Bennett Village Drive, Maryville, TN 37804
MLS# 1321566Listed by: WOODY CREEK REALTY, LLC $299,900Pending2 beds 2 baths1,238 sq. ft.
411 Regal Tower #411, Maryville, TN 37804
MLS# 1321550Listed by: REALTY EXECUTIVES ASSOCIATES $100,000Pending2.31 Acres
Nina Delozier Rd, Maryville, TN 37804
MLS# 1321380Listed by: WALLACE NELSON REAL ESTATE $100,000Pending2.39 Acres
919 Nina Delozier Rd, Maryville, TN 37804
MLS# 1321378Listed by: WALLACE NELSON REAL ESTATE $349,900Pending3 beds 3 baths1,480 sq. ft.
2201 Ridgecrest Drive, Maryville, TN 37803
MLS# 1321314Listed by: REALTY EXECUTIVES ASSOCIATES $295,000Pending3 beds 1 baths1,189 sq. ft.
204 Seventh St, Maryville, TN 37804
MLS# 1321265Listed by: WALLACE NELSON REAL ESTATE $403,077Active4 beds 3 baths2,071 sq. ft.
3534 Crimson Circle, Maryville, TN 37801
MLS# 1321025Listed by: REALTY EXECUTIVES ASSOCIATES- Open Sat, 5 to 9pm
 $427,967Active4 beds 3 baths2,519 sq. ft.
201 Clover Meadow Lane, Maryville, TN 37801
MLS# 1320924Listed by: REALTY EXECUTIVES ASSOCIATES  $350,000Active3 beds 2 baths1,411 sq. ft.
1820 Forest Hill Road, Maryville, TN 37803
MLS# 1523353Listed by: THE SOURCE REAL ESTATE GROUP $375,000Pending3 beds 3 baths1,850 sq. ft.
1804 Bennett Village Drive, Maryville, TN 37804
MLS# 1320694Listed by: WOODY CREEK REALTY, LLC $396,900Active3 beds 2 baths1,446 sq. ft.
1414 Wales Ave, Maryville, TN 37804
MLS# 1320522Listed by: REALTY EXECUTIVES ASSOCIATES $1,350,000Active4 beds 4 baths3,384 sq. ft.
821 Franklin Crossing, Maryville, TN 37804
MLS# 1320306Listed by: THE PRICE AGENCY, REALTY EXECUTIVES $454,078Active5 beds 3 baths2,459 sq. ft.
209 Clover Meadow Lane, Maryville, TN 37801
MLS# 1319815Listed by: REALTY EXECUTIVES ASSOCIATES $625,000Active5 beds 4 baths2,809 sq. ft.
1628 Loch Leigh Way, Maryville, TN 37801
MLS# 1319745Listed by: WALLACE $380,130Pending4 beds 3 baths1,991 sq. ft.
1340 Three Horses Lane, Maryville, TN 37803
MLS# 1319700Listed by: D.R. HORTON $379,900Active3 beds 1 baths1,423 sq. ft.
220 Butler Mill Rd, Maryville, TN 37803
MLS# 1325460Listed by: KNOX NATIVE REAL ESTATE $29,000Active0.43 Acres
203 Allen Court, Maryville, TN 37804
MLS# 1319208Listed by: REALTY EXECUTIVES ASSOCIATES $399,900Pending3 beds 2 baths1,940 sq. ft.
1511 Mayapple Drive, Maryville, TN 37801
MLS# 1319203Listed by: REALTY EXECUTIVES ASSOCIATES $395,000Pending3 beds 3 baths2,797 sq. ft.
3037 Marvin Circle, Maryville, TN 37803
MLS# 1318863Listed by: EXP REALTY, LLC $735,000Pending4 beds 3 baths2,665 sq. ft.
534 Argyle Way, Maryville, TN 37801
MLS# 1318821Listed by: KELLER WILLIAMS REALTY $475,000Active5 beds 3 baths2,228 sq. ft.
2327 Eau Clair Drive, Maryville, TN 37803
MLS# 3015213Listed by: WALLACE $353,000Pending3 beds 2 baths1,648 sq. ft.
2117 Grey Ridge Rd, Maryville, TN 37801
MLS# 1318415Listed by: EXP REALTY, LLC $369,900Active3 beds 3 baths1,772 sq. ft.
2812 Ridgeview Drive, Maryville, TN 37801
MLS# 1318369Listed by: REALTY EXECUTIVES ASSOCIATES $689,900Active4 beds 3 baths3,600 sq. ft.
3231 Reiley Drive, Maryville, TN 37801
MLS# 1318335Listed by: REALTY EXECUTIVES ASSOCIATES $369,000Pending3 beds 2 baths1,898 sq. ft.
2839 New Blockhouse Rd, Maryville, TN 37803
MLS# 1318325Listed by: HOMETOWN REALTY, LLC $375,000Pending3 beds 3 baths1,850 sq. ft.
1810 Bennett Village Drive, Maryville, TN 37804
MLS# 1318249Listed by: WOODY CREEK REALTY, LLC $382,500Active3 beds 2 baths1,702 sq. ft.
205 Royal Oaks Drive, Maryville, TN 37801
MLS# 1318180Listed by: LECONTE REALTY, LLC $409,999Pending3 beds 3 baths1,931 sq. ft.
1420 Hartford Ave, Maryville, TN 37803
MLS# 1318176Listed by: WALLACE $357,500Active4 beds 2 baths1,692 sq. ft.
2145 Highland Rd, Maryville, TN 37801
MLS# 1318116Listed by: THE HOUSE STORE $1,499,900Pending4 beds 3 baths3,730 sq. ft.
4628 Us-411, Maryville, TN 37801
MLS# 1318135Listed by: REALTY EXECUTIVES ASSOCIATES $339,900Pending3 beds 2 baths1,452 sq. ft.
1907 Crest Rd, Maryville, TN 37804
MLS# 1317911Listed by: REALTY EXECUTIVES ASSOCIATES $1,950,000Pending-- beds -- baths13,380 sq. ft.
161 E Harper Ave, Maryville, TN 37804
MLS# 1317854Listed by: WALLACE NELSON REAL ESTATE $315,650Pending2 beds 3 baths1,471 sq. ft.
1712 Bennett Village Drive, Maryville, TN 37804
MLS# 1317600Listed by: WOODY CREEK REALTY, LLC $350,000Pending3 beds 2 baths1,314 sq. ft.
218 Doris Lane, Maryville, TN 37803
MLS# 1317504Listed by: REMAX FIRST $339,900Active2 beds 2 baths1,316 sq. ft.
2732 Waters Place Drive, Maryville, TN 37803
MLS# 1317229Listed by: BEYCOME BROKERAGE REALTY, LLC $534,900Active4 beds 2 baths1,999 sq. ft.
1212 Fort Craig Tr, Maryville, TN 37803
MLS# 1316987Listed by: KELLER WILLIAMS SIGNATURE $625,000Active4 beds 3 baths3,400 sq. ft.
2750 Tn-72, Maryville, TN 37801
MLS# 1316622Listed by: REALTY EXECUTIVES ASSOCIATES $429,500Pending3 beds 2 baths2,160 sq. ft.
926 Brentwood Drive, Maryville, TN 37804
MLS# 1316653Listed by: BLEVINS GRP, REALTY EXECUTIVES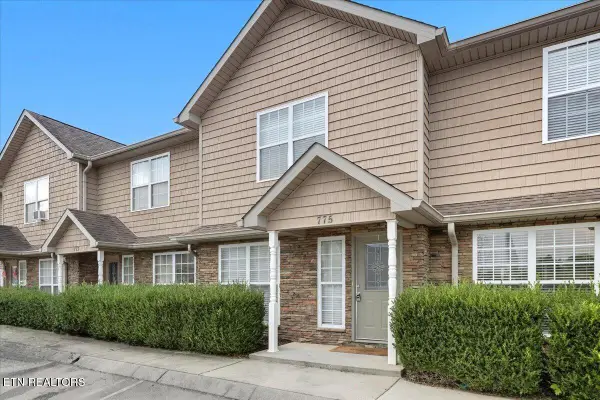 $274,900Pending2 beds 3 baths1,440 sq. ft.
775 Casey Lane, Maryville, TN 37801
MLS# 1316497Listed by: REALTY EXECUTIVES ASSOCIATES $585,000Pending4 beds 3 baths2,636 sq. ft.
319 Kenmark Drive, Maryville, TN 37803
MLS# 1316207Listed by: KELLER WILLIAMS REALTY $540,000Active4 beds 3 baths3,492 sq. ft.
1218 Hitch Rd, Maryville, TN 37804
MLS# 1315831Listed by: ALLIANCE SOTHEBY'S INTERNATIONAL $373,000Pending3 beds 3 baths1,850 sq. ft.
1818 Bennett Village Drive, Maryville, TN 37804
MLS# 1315395Listed by: WOODY CREEK REALTY, LLC $364,900Pending3 beds 2 baths1,431 sq. ft.
2117 Old Niles Ferry Rd, Maryville, TN 37803
MLS# 1314911Listed by: REALTY EXECUTIVES ASSOCIATES $89,900Pending0.71 Acres
Lot 36 Whispering Springs, Maryville, TN 37803
MLS# 1314262Listed by: BLEVINS GRP, REALTY EXECUTIVES $89,900Pending1.16 Acres
Lot 34 Whispering Springs, Maryville, TN 37803
MLS# 1314263Listed by: BLEVINS GRP, REALTY EXECUTIVES $89,900Pending0.8 Acres
Lot 35 Whispering Springs, Maryville, TN 37803
MLS# 1314264Listed by: BLEVINS GRP, REALTY EXECUTIVES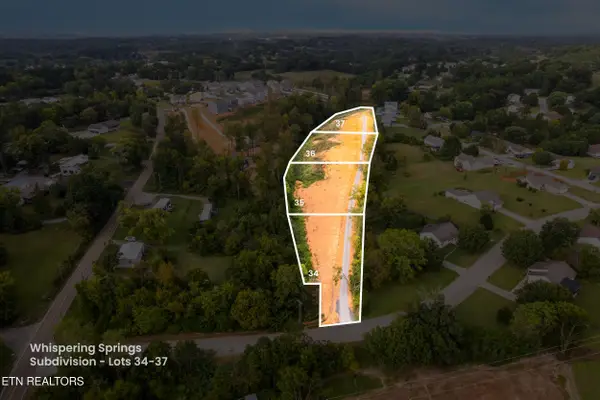 $89,900Pending0.99 Acres
Lot 37 Whispering Springs, Maryville, TN 37803
MLS# 1314266Listed by: BLEVINS GRP, REALTY EXECUTIVES $2,000,000Pending22.46 Acres
1407 Montvale Rd, Maryville, TN 37803
MLS# 1313708Listed by: REALTY EXECUTIVES ASSOCIATES $452,149Active4 beds 3 baths2,459 sq. ft.
3527 Crimson Circle, Maryville, TN 37801
MLS# 2985665Listed by: REALTY EXECUTIVES ASSOCIATES $225,000Active2 beds 2 baths960 sq. ft.
809 S Everett High Rd, Maryville, TN 37804
MLS# 1313655Listed by: EXP REALTY, LLC $365,000Pending8.9 Acres
2661 Tuckaleechee Pike, Maryville, TN 37803
MLS# 1313535Listed by: REALTY EXECUTIVES ASSOCIATES $999,900Pending4 beds 6 baths3,604 sq. ft.
2613 Cross Creek Drive, Maryville, TN 37803
MLS# 1313484Listed by: BLEVINS GRP, REALTY EXECUTIVES $579,900Pending4 beds 3 baths2,600 sq. ft.
1314 Fort Craig Tr, Maryville, TN 37803
MLS# 1313298Listed by: KELLER WILLIAMS SIGNATURE $399,900Active2 beds 1 baths1,590 sq. ft.
3618 Big Springs Rd, Maryville, TN 37801
MLS# 1328637Listed by: WALLACE NELSON REAL ESTATE $599,000Pending4 beds 4 baths2,985 sq. ft.
1310 Fort Craig Tr, Maryville, TN 37803
MLS# 1311675Listed by: KELLER WILLIAMS SIGNATURE $480,000Active24 Acres
4575 Crooked Creek Way Lots 2 & 3, Maryville, TN 37803
MLS# 307757Listed by: WALLACE REAL ESTATE LAKESIDE $475,000Active3 beds 3 baths2,410 sq. ft.
118 Scenic Yard Lane, Maryville, TN 37804
MLS# 2971092Listed by: KELLER WILLIAMS $370,000Pending3 beds 3 baths1,850 sq. ft.
1832 Bennett Village Drive, Maryville, TN 37804
MLS# 1310770Listed by: WOODY CREEK REALTY, LLC $425,000Active3 beds 3 baths2,052 sq. ft.
2809 Cansler Drive, Maryville, TN 37801
MLS# 1309538Listed by: LITTLE RIVER REALTY $447,000Active3 beds 2 baths1,765 sq. ft.
1026 Saint Johns Drive, Maryville, TN 37801
MLS# 1328185Listed by: LPT REALTY, LLC $80,000Active0.46 Acres
308 Ross Springs Drive, Maryville, TN 37803
MLS# 1326591Listed by: WALLACE NELSON REAL ESTATE $374,900Pending3 beds 3 baths1,850 sq. ft.
1827 Bennett Village Drive, Maryville, TN 37804
MLS# 1308298Listed by: WOODY CREEK REALTY, LLC $595,000Pending5 beds 3 baths2,654 sq. ft.
1206 Fort Craig Tr, Maryville, TN 37803
MLS# 1307934Listed by: KELLER WILLIAMS SIGNATURE $390,000Pending3 beds 2 baths1,957 sq. ft.
1733 Forster St, Maryville, TN 37803
MLS# 1307880Listed by: LECONTE REALTY, LLC $464,000Pending3 beds 3 baths3,094 sq. ft.
2822 Rambling Rd, Maryville, TN 37801
MLS# 1307467Listed by: REALTY EXECUTIVES ASSOCIATES $551,000Pending29 Acres
Blockhouse Rd, Maryville, TN 37803
MLS# 1306989Listed by: WHITETAIL PROPERTIES REAL ESTATE, LLC $584,900Pending3 beds 5 baths3,380 sq. ft.
2929 Innisbrook Drive, Maryville, TN 37801
MLS# 1306397Listed by: PACE PROBITY ASSET MANAGEMENT $589,900Active4 beds 4 baths2,752 sq. ft.
1416 Broad Run Drive, Maryville, TN 37803
MLS# 1324940Listed by: WALLACE NELSON REAL ESTATE $725,000Pending4 beds 3 baths4,652 sq. ft.
310 Meredith Court, Maryville, TN 37803
MLS# 1325977Listed by: REALTY EXECUTIVES SMOKY MOUNTAINS $299,900Pending3 beds 3 baths1,639 sq. ft.
209 Covington Lane, Maryville, TN 37804
MLS# 1326153Listed by: KELLER WILLIAMS $429,117Pending4 beds 3 baths2,519 sq. ft.
3513 Crimson Circle, Maryville, TN 37801
MLS# 1300858Listed by: REALTY EXECUTIVES ASSOCIATES $182,000Pending0.65 Acres
1144 Heathmoore Court, Maryville, TN 37803
MLS# 1301431Listed by: REALTY EXECUTIVES ASSOCIATES $425,859Active4 beds 3 baths2,143 sq. ft.
3649 Crimson Circle, Maryville, TN 37801
MLS# 1301764Listed by: REALTY EXECUTIVES ASSOCIATES $1,310,900Active3 beds 3 baths4,900 sq. ft.
530 Blockhouse Rd, Maryville, TN 37803
MLS# 2883646Listed by: REALTY EXECUTIVES ASSOCIATES $439,000Pending3 beds 3 baths2,292 sq. ft.
1628 Linda Lane, Maryville, TN 37803
MLS# 1320269Listed by: REALTY EXECUTIVES ASSOCIATES $574,900Active4 beds 3 baths3,100 sq. ft.
1414 Andera Drive, Maryville, TN 37801
MLS# 9979665Listed by: BLUE RIDGE PROPERTIES $240,000Active12 Acres
4575 Crooked Creek Way Lot 2, Maryville, TN 37803
MLS# 307758Listed by: WALLACE REAL ESTATE LAKESIDE $240,000Active12 Acres
4585 Crooked Creek Way Lot 3, Maryville, TN 37803
MLS# 307759Listed by: WALLACE REAL ESTATE LAKESIDE $269,000Active3 beds 1 baths1,548 sq. ft.
1301 Jefferson Ave, Maryville, TN 37804
MLS# 1326384Listed by: NEXTHOME CLINCH VALLEY $409,000Pending4 beds 3 baths2,634 sq. ft.
119 Colts Tr, Maryville, TN 37803
MLS# 1298186Listed by: ALLIANCE SOTHEBY'S INTERNATIONAL $699,900Active4 beds 4 baths4,146 sq. ft.
2109 Southwood Drive, Maryville, TN 37803
MLS# 1297812Listed by: REALTY EXECUTIVES ASSOCIATES $398,849Pending4 beds 3 baths1,997 sq. ft.
3523 Crimson Circle, Maryville, TN 37801
MLS# 1296332Listed by: REALTY EXECUTIVES ASSOCIATES $289,900Pending2 beds 2 baths1,238 sq. ft.
111 Regal Tower, Maryville, TN 37804
MLS# 1294466Listed by: REALTY EXECUTIVES ASSOCIATES $375,000Pending3 beds 3 baths1,850 sq. ft.
1821 Bennett Village Drive, Maryville, TN 37804
MLS# 1294328Listed by: WOODY CREEK REALTY, LLC $443,701Pending4 beds 3 baths2,719 sq. ft.
3514 Crimson Circle, Maryville, TN 37801
MLS# 1291874Listed by: REALTY EXECUTIVES ASSOCIATES $950,000Active4 beds 3 baths3,551 sq. ft.
2014 Legacy Lane, Maryville, TN 37803
MLS# 1323631Listed by: WALLACE NELSON REAL ESTATE $450,000Pending2 beds 2 baths1,193 sq. ft.
410 E Church Ave, Maryville, TN 37804
MLS# 1288900Listed by: LECONTE REALTY, LLC $2,500,000Pending-- beds -- baths12,804 sq. ft.
102 Asbury Way, Maryville, TN 37804
MLS# 1298964Listed by: SKYWAY REALTY LAND & HOMES $424,900Active3 beds 2 baths2,323 sq. ft.
1534 Mcilvaine Drive, Maryville, TN 37803
MLS# 1321279Listed by: REALTY EXECUTIVES ASSOCIATES $450,000Active2 beds 2 baths1,193 sq. ft.
408 E Church Ave, Maryville, TN 37804
MLS# 1329973Listed by: LECONTE REALTY, LLC $329,900Pending2 beds 3 baths1,471 sq. ft.
1330 Mountain Quail Circle, Maryville, TN 37801
MLS# 1328004Listed by: KELLER WILLIAMS $119,000Active0.96 Acres
1273 Middlesettlements Rd, Maryville, TN 37801
MLS# 1273607Listed by: REALTY EXECUTIVES ASSOCIATES $299,900Pending3 beds 2 baths1,248 sq. ft.
2102 Montvale Rd, Maryville, TN 37803
MLS# 1287588Listed by: REALTY EXECUTIVES ASSOCIATES $695,000Pending-- beds -- baths
106 S 5th St, Maryville, TN 37804
MLS# 1236366Listed by: NAI KOELLA L RM MOORE $445,000Active3 beds 3 baths1,794 sq. ft.
1507 Water Lily Lane, Maryville, TN 37801
MLS# 1330056Listed by: KELLER WILLIAMS
Local realty services provided by:CENTURY 21 Legacy, CENTURY 21 Premier, CENTURY 21 BELLORA
Neighborhoods near Maryville, TN
Zip codes near Maryville, TN
- 37701 homes for sale
- 37737 homes for sale
- 37742 homes for sale
- 37772 homes for sale
- 37777 homes for sale
- 37801 homes for sale
- 37803 homes for sale
- 37804 homes for sale
- 37853 homes for sale
- 37865 homes for sale
- 37878 homes for sale
- 37886 homes for sale
- 37902 homes for sale
- 37909 homes for sale
- 37916 homes for sale
- 37919 homes for sale
- 37920 homes for sale
- 37922 homes for sale
- 37923 homes for sale
- 37934 homes for sale
Popular searches near Maryville, TN
- Alcoa homes for sale
- Eagleton Village homes for sale
- Farragut homes for sale
- Friendsville homes for sale
- Greenback homes for sale
- Kahite homes for sale
- Karns homes for sale
- Knoxville homes for sale
- Lenoir City homes for sale
- Louisville homes for sale
- Powell homes for sale
- Rarity Bay homes for sale
- Rockford homes for sale
- Seymour homes for sale
- Tallassee homes for sale
- Tellico Village homes for sale
- Townsend homes for sale
- Vonore homes for sale
- Walland homes for sale
- Wildwood homes for sale
Protect your home and budget from life's surprises with an Assurant Home Warranty, backed by a partner that supports you through every step of homeownership. Explore Plans.
©2026 Century 21 Real Estate LLC. All rights reserved. CENTURY 21®, the CENTURY 21 Logo and C21® are service marks owned by Century 21 Real Estate LLC. Century 21 Real Estate LLC fully supports the principles of the Fair Housing Act and the Equal Opportunity Act. Each office is independently owned and operated. Listing information is deemed reliable but not guaranteed accurate.