- Bakewell homes for sale
- Birchwood homes for sale
- Chattanooga homes for sale
- Collegedale homes for sale
- Fairmount homes for sale
- Falling Water homes for sale
- Flat Top Mountain homes for sale
- Harrison homes for sale
- Hixson homes for sale
- Lakesite homes for sale
- Lone Oak homes for sale
- McDonald homes for sale
- Middle Valley homes for sale
- Mowbray Mountain homes for sale
- Ooltewah homes for sale
- Red Bank homes for sale
- Sale Creek homes for sale
- Signal Mountain homes for sale
- Soddy-Daisy homes for sale
- Walden homes for sale
Hamilton County, TN - homes for sale
300 of 3,318 results displayed
- New
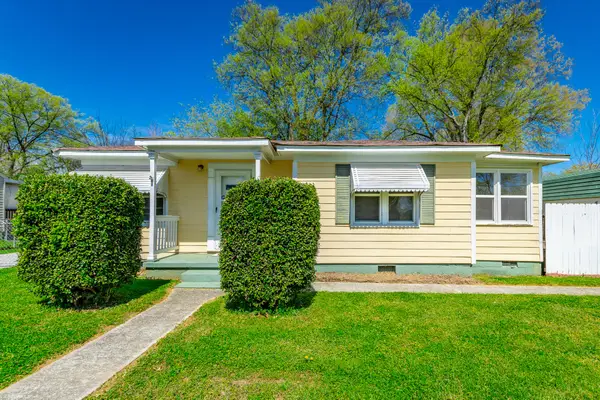
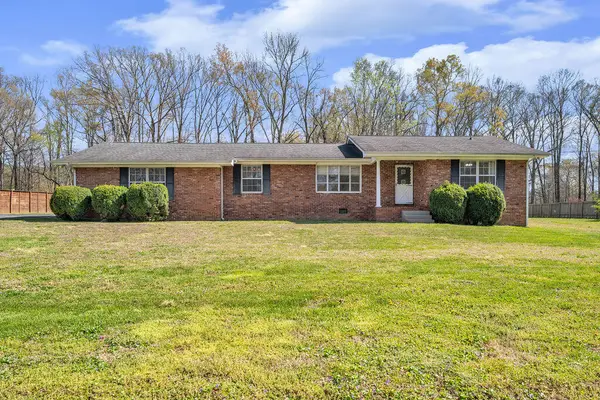
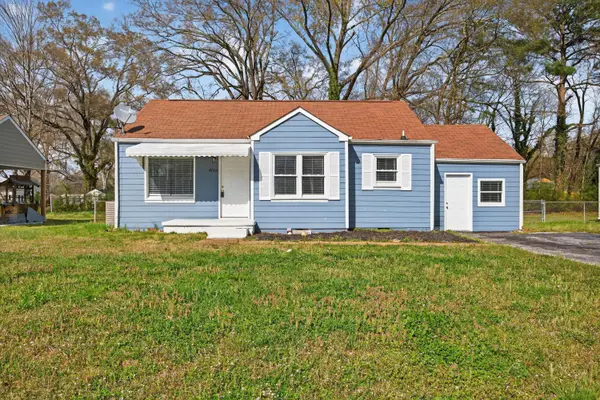
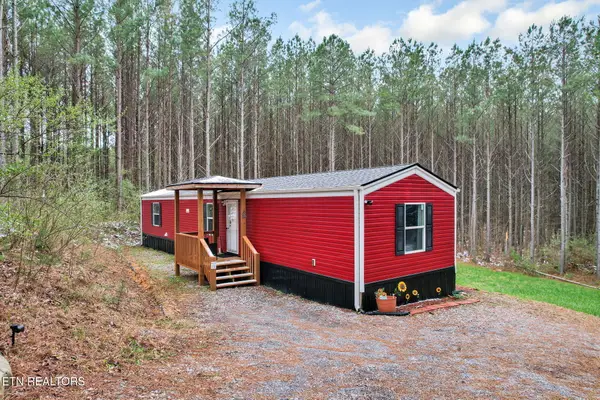
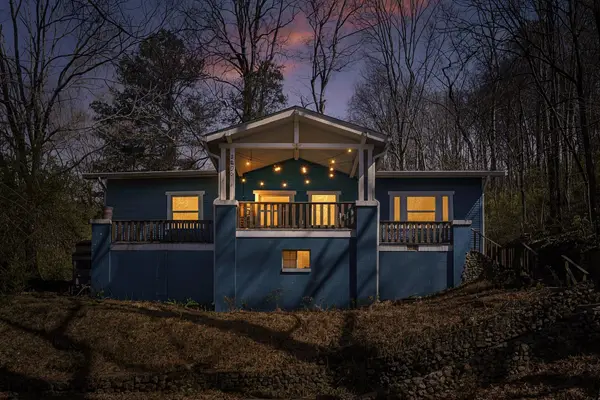
 $305,000Active3 beds 2 baths1,640 sq. ft.
4421 Kayla Circle, Chattanooga, TN 37406
MLS# 1531218Listed by: REAL BROKER - New
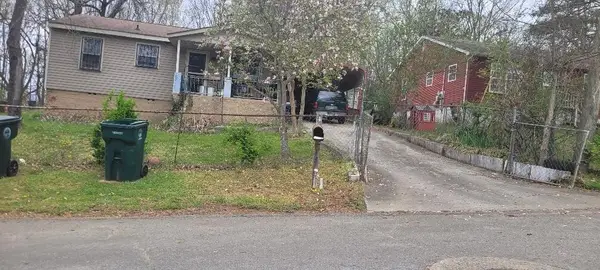
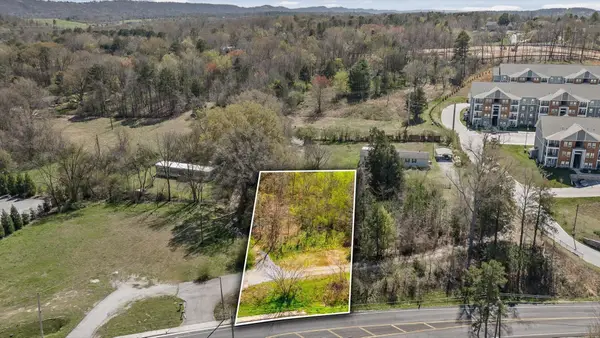
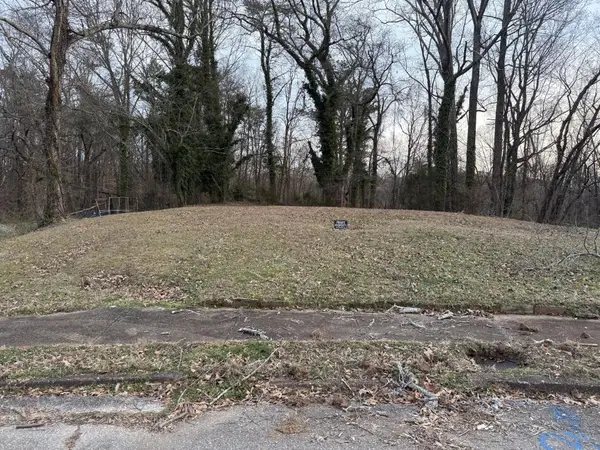
 $50,000Active0.5 Acres
1095 Dayton Boulevard, Chattanooga, TN 37415
MLS# 1531220Listed by: REAL ESTATE PARTNERS CHATTANOOGA LLC - New
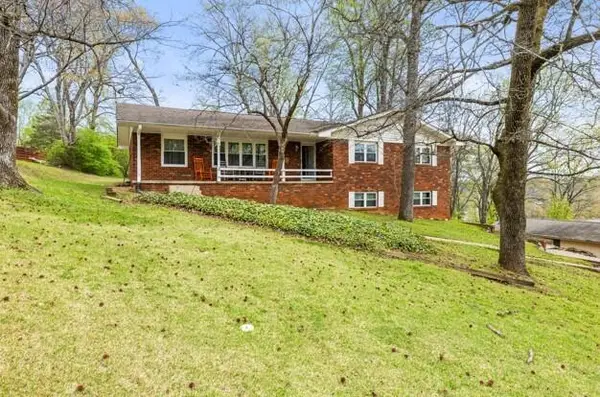
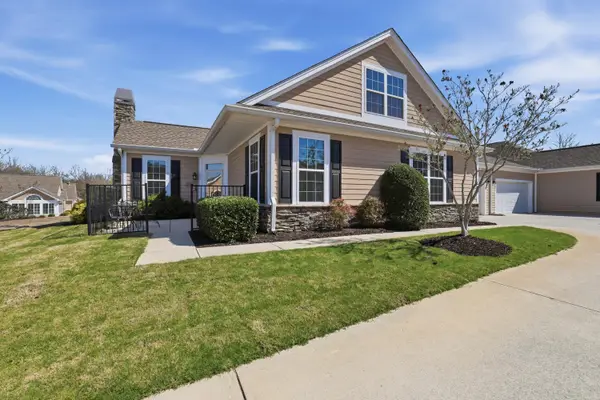
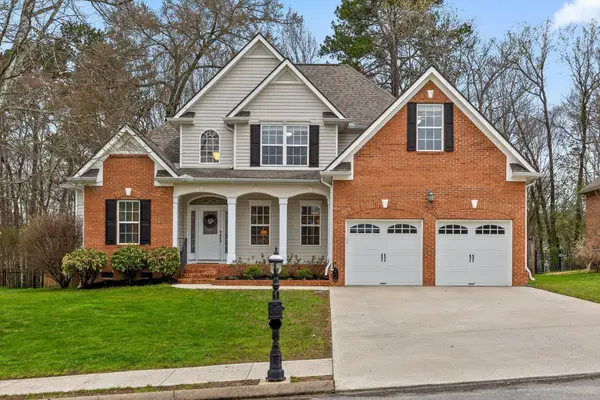
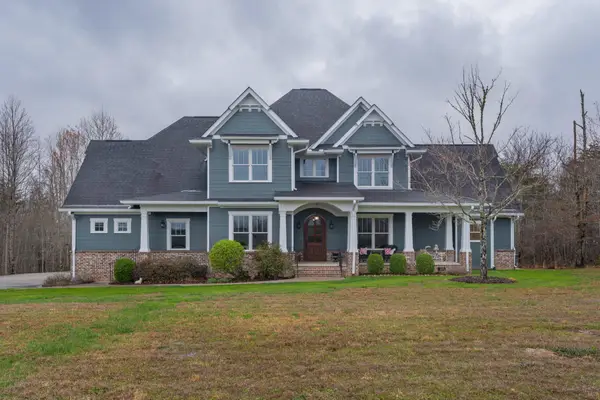
 $850,000Active4 beds 4 baths3,947 sq. ft.
9347 Bronze Branch Lane, Apison, TN 37302
MLS# 1531210Listed by: KELLER WILLIAMS REALTY - New
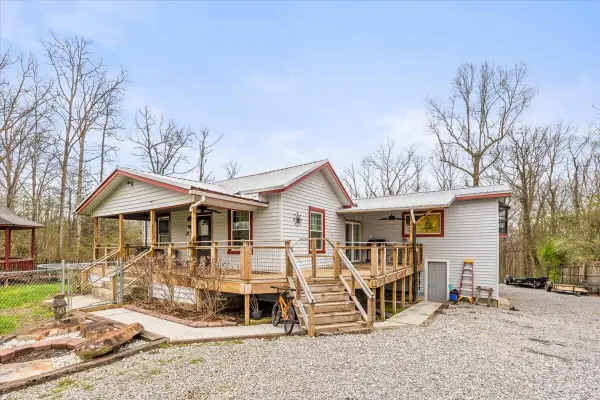
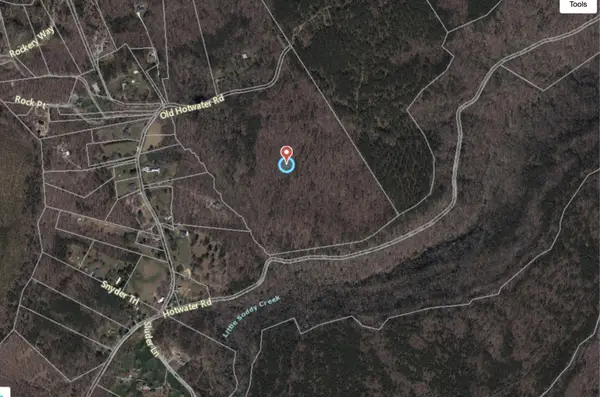
 $180,000Active8.9 Acres
7327 Greenwood Road, Harrison, TN 37341
MLS# 1531216Listed by: RE/MAX PROPERTIES - New
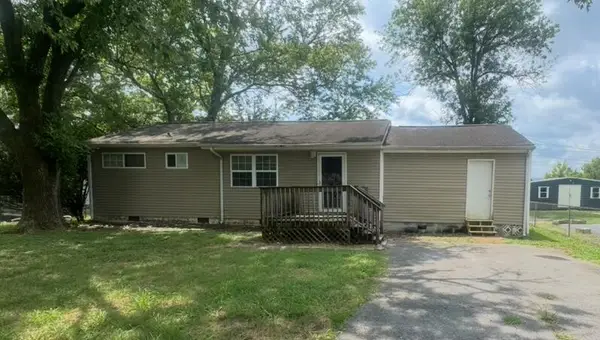
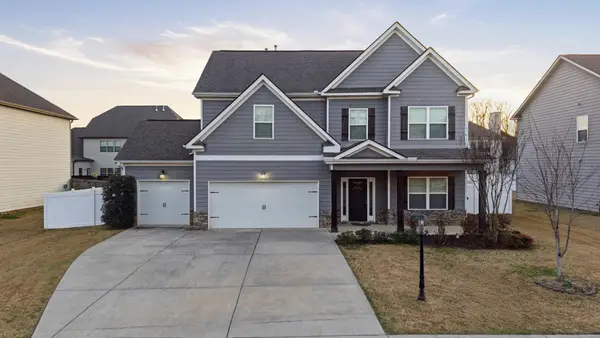
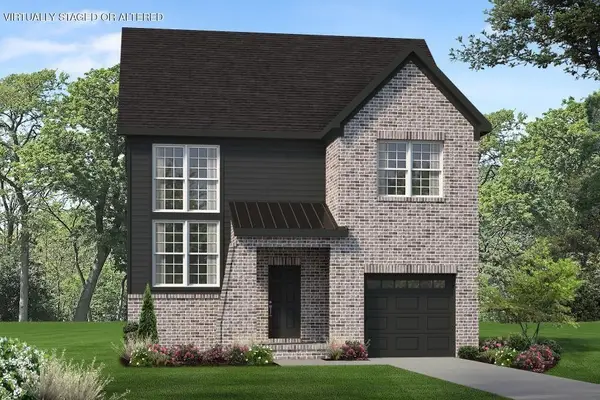
 $220,000Active2 beds 1 baths1,042 sq. ft.
1713 Strawberry Lane, Hixson, TN 37343
MLS# 1531193Listed by: CRYE-LEIKE, REALTORS - New
 $350,000Active3 beds 2 baths2,047 sq. ft.
23 Holiday Lane, Chattanooga, TN 37415
MLS# 1531195Listed by: KELLER WILLIAMS REALTY - New
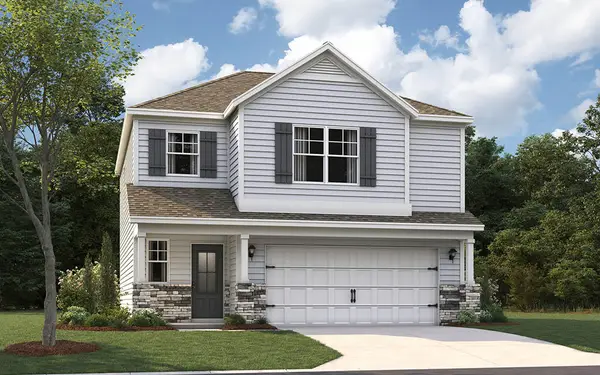 $375,655Active3 beds 3 baths1,749 sq. ft.
8248 Bright Water Dr, Ooltewah, TN 37363
MLS# 1531196Listed by: DHI INC - New

 $45,000Active0.5 Acres
10725 Dallas Hollow Road, Soddy Daisy, TN 37379
MLS# 1531197Listed by: CENTURY 21 CUMBERLAND REALTY - New
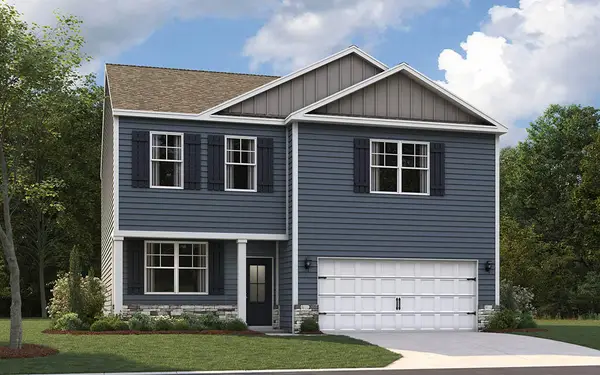 $392,205Active3 beds 3 baths2,160 sq. ft.
8254 Bright Water Dr, Ooltewah, TN 37363
MLS# 1531198Listed by: DHI INC - New
 $519,900Active5 beds 3 baths3,020 sq. ft.
7280 Scituate Lane #46, Ooltewah, TN 37363
MLS# 1531199Listed by: TRUST REAL ESTATE GROUP, LLC - New
 $575,000Active3 beds 2 baths2,292 sq. ft.
10287 Wagon Wheel Terrace, Harrison, TN 37341
MLS# 1531200Listed by: KELLER WILLIAMS REALTY - New
 $436,545Active4 beds 3 baths2,804 sq. ft.
8491 Watercolour Lane, Ooltewah, TN 37363
MLS# 1531203Listed by: DHI INC - New
 $380,000Active1 beds 1 baths699 sq. ft.
200 Manufacturers Road #Apt 619, Chattanooga, TN 37405
MLS# 1531204Listed by: FLETCHER BRIGHT REALTY - New
 $460,000Active2 beds 3 baths1,500 sq. ft.
127 Lead Lane #33, Chattanooga, TN 37405
MLS# 1531205Listed by: EAH BROKERAGE, LP - New
 $325,000Active3 beds 2 baths1,499 sq. ft.
7450 Min Tom Road, Chattanooga, TN 37421
MLS# 1531206Listed by: CRYE-LEIKE, REALTORS - Open Sat, 12 to 2pmNew
 $570,000Active4 beds 3 baths3,125 sq. ft.
6900 Snow View Lane, Ooltewah, TN 37363
MLS# 1531188Listed by: EXP REALTY, LLC - New
 $859,000Active2 beds 1 baths956 sq. ft.
7319 Ooltewah Georgetown Road, Ooltewah, TN 37363
MLS# 1531190Listed by: ZACH TAYLOR - CHATTANOOGA - New
 $449,900Active3 beds 3 baths1,716 sq. ft.
4819 Montcrest Dr, Chattanooga, TN 37416
MLS# 3160179Listed by: SIMPLIHOM - New
 $205,000Active0.56 Acres
912 Glamis Circle, Signal Mountain, TN 37377
MLS# 1531178Listed by: KELLER WILLIAMS REALTY - Open Sun, 2 to 4pmNew
 $642,000Active4 beds 3 baths2,777 sq. ft.
4046 Brock Road, Chattanooga, TN 37421
MLS# 1531181Listed by: RE/MAX RENAISSANCE REALTORS - Open Sat, 2 to 4pm
 $355,000Active4 beds 3 baths2,380 sq. ft.
2105 Port Royal Drive, Soddy Daisy, TN 37379
MLS# 1529369Listed by: KELLER WILLIAMS REALTY - Open Sat, 2 to 4pmNew
 $434,900Active5 beds 3 baths2,960 sq. ft.
1715 Lake Wood Circle, Hixson, TN 37343
MLS# 1531173Listed by: KELLER WILLIAMS REALTY - New
 $345,000Active3 beds 2 baths1,495 sq. ft.
863 Flynn Street #104, Chattanooga, TN 37403
MLS# 1531167Listed by: REAL ESTATE PARTNERS CHATTANOOGA LLC - New
 $370,000Active5 beds 8 baths2,961 sq. ft.
1905 Bella Vista Drive, Chattanooga, TN 37421
MLS# 1531169Listed by: KELLER WILLIAMS REALTY - New
 $425,000Active4 beds 3 baths2,710 sq. ft.
528 S Seminole Drive, Chattanooga, TN 37412
MLS# 1531171Listed by: KELLER WILLIAMS REALTY  $735,000Active3 beds 3 baths1,732 sq. ft.
4 Cherokee Boulevard #225, Chattanooga, TN 37405
MLS# 1395371Listed by: COLDWELL BANKER KINARD COMMERCIAL- New
 $458,500Active5 beds 3 baths3,400 sq. ft.
710 Highview Drive, Chattanooga, TN 37415
MLS# 1531153Listed by: CRYE-LEIKE, REALTORS - Open Sun, 11am to 1pmNew
 $315,000Active4 beds 3 baths2,160 sq. ft.
7849 Huntington Forest Drive, Hixson, TN 37343
MLS# 1531155Listed by: REAL ESTATE PARTNERS CHATTANOOGA LLC - New
 $324,900Active4 beds 2 baths1,691 sq. ft.
7004 Ramseytown Road, Harrison, TN 37341
MLS# 1531157Listed by: 1 PERCENT LISTS SCENIC CITY - New
 $239,900Active3 beds 2 baths1,200 sq. ft.
1305 Hixson Avenue, Hixson, TN 37343
MLS# 1531149Listed by: KELLER WILLIAMS REALTY - New
 $250,000Active2 beds 3 baths1,260 sq. ft.
527 Winterview Lane, Chattanooga, TN 37409
MLS# 1531152Listed by: ZACH TAYLOR - CHATTANOOGA - New
 $529,900Active2 beds 3 baths1,867 sq. ft.
1006 Southbridge Lane, Chattanooga, TN 37405
MLS# 1531132Listed by: REAL ESTATE PARTNERS CHATTANOOGA LLC - New
 $199,000Active3 beds 1 baths988 sq. ft.
1334 Crawford Street, Chattanooga, TN 37421
MLS# 1531131Listed by: STONE RIVER PROPERTY MANAGEMENT - New
 $755,000Active4 beds 4 baths3,288 sq. ft.
1395 Sawyer Cemetery Road, Signal Mountain, TN 37377
MLS# 1531134Listed by: KELLER WILLIAMS REALTY - Open Sun, 2 to 4pmNew
 $400,000Active3 beds 2 baths1,697 sq. ft.
6105 Amber Forest Trail #38, Hixson, TN 37343
MLS# 1531135Listed by: EXP REALTY, LLC - New
 $1,325,000Active2 beds 2 baths1,938 sq. ft.
99 Walnut Street #Apt 504, Chattanooga, TN 37403
MLS# 1531144Listed by: FIV REALTY CO TENNESSEE LLC - Open Sun, 2 to 4pmNew
 $375,000Active2 beds 3 baths2,137 sq. ft.
1278 Village Green Drive, Hixson, TN 37343
MLS# 1531146Listed by: ZACH TAYLOR - CHATTANOOGA - New
 $725,000Active5 beds 3 baths2,915 sq. ft.
747 Deer Valley Drive, Hixson, TN 37343
MLS# 1531147Listed by: REALTY SPECIALISTS - Coming Soon
 $425,000Coming Soon3 beds 3 baths
4071 Inlet Loop, Chattanooga, TN 37416
MLS# 3159703Listed by: EXP REALTY LLC - Coming SoonOpen Sun, 1 to 3pm
 $599,900Coming Soon4 beds 3 baths
8815 Silver Maple Drive, Ooltewah, TN 37363
MLS# 3159755Listed by: EXP REALTY LLC - New
 $549,900Active5 beds 3 baths2,819 sq. ft.
7724 Peppertree Drive, Ooltewah, TN 37363
MLS# 3159853Listed by: REAL ESTATE PARTNERS CHATTANOOGA, LLC - New
 $150,000Active3 beds 1 baths1,036 sq. ft.
2592 E 39th Street, Chattanooga, TN 37407
MLS# 1531129Listed by: KELLER WILLIAMS REALTY - Open Sun, 2 to 4pm
 $575,000Active4 beds 3 baths3,958 sq. ft.
7187 Homestead Circle, Hixson, TN 37343
MLS# 1529146Listed by: EXP REALTY, LLC - Open Sun, 2 to 4pm
 $875,000Active4 beds 3 baths2,592 sq. ft.
4118 Saint Elmo Avenue, Chattanooga, TN 37409
MLS# 1530170Listed by: KELLER WILLIAMS REALTY  $250,000Active2 beds 2 baths1,344 sq. ft.
713 Hargraves Avenue, Chattanooga, TN 37411
MLS# 1530239Listed by: KELLER WILLIAMS REALTY- Open Sat, 1 to 3pmNew
 $399,000Active4 beds 3 baths2,188 sq. ft.
7225 Fairington Circle, Hixson, TN 37343
MLS# 1530915Listed by: KELLER WILLIAMS REALTY - Open Sat, 1 to 3pmNew
 $315,000Active3 beds 2 baths1,620 sq. ft.
5739 Old Dayton Pike, Chattanooga, TN 37415
MLS# 1531125Listed by: KELLER WILLIAMS REALTY - New
 $550,000Active23.1 Acres
6587 Fairview Road, Hixson, TN 37343
MLS# 1531120Listed by: KELLER WILLIAMS REALTY - New
 $300,000Active3.02 Acres
6583 Fairview Road, Hixson, TN 37343
MLS# 1531121Listed by: KELLER WILLIAMS REALTY - New
 $1,600,000Active62.6 Acres
000 Fairview Road, Chattanooga, TN 37341
MLS# 1531124Listed by: KELLER WILLIAMS REALTY - New
 $399,000Active3 beds 2 baths1,995 sq. ft.
4323 Norcross Road, Hixson, TN 37343
MLS# 1531111Listed by: DAVANZO REAL ESTATE - New
 $615,000Active3 beds 3 baths2,040 sq. ft.
2003 Clearfield Lane, Chattanooga, TN 37405
MLS# 1531116Listed by: KELLER WILLIAMS REALTY - New
 $365,000Active3 beds 2 baths1,596 sq. ft.
7446 Salmon Lane, Ooltewah, TN 37363
MLS# 1531098Listed by: OPENDOOR BROKERAGE LLC - New
 $425,000Active2 beds 2 baths1,680 sq. ft.
1000 E Martin Luther King Boulevard #203, Chattanooga, TN 37403
MLS# 1531099Listed by: REAL ESTATE PARTNERS CHATTANOOGA LLC - New
 $310,000Active3 beds 2 baths1,576 sq. ft.
4333 Comet Trail, Hixson, TN 37343
MLS# 1531101Listed by: KELLER WILLIAMS REALTY - New
 $396,000Active5 beds 2 baths1,924 sq. ft.
1121 O Henry Drive, Hixson, TN 37343
MLS# 1531109Listed by: UPTOWN FIRM, LLC - Open Sun, 1 to 3pmNew
 $550,000Active5 beds 4 baths2,780 sq. ft.
1548 Bourbon Way, Chattanooga, TN 37421
MLS# 3159622Listed by: GREATER DOWNTOWN REALTY DBA KELLER WILLIAMS REALTY - New
 $179,900Active2 beds 1 baths1,150 sq. ft.
303 Main Street, Soddy Daisy, TN 37379
MLS# 1531095Listed by: RE/MAX RENAISSANCE REALTORS - New
 $174,900Active0.15 Acres
522 Crewdson Street #11, Chattanooga, TN 37405
MLS# 1530856Listed by: REAL ESTATE PARTNERS CHATTANOOGA LLC  $270,000Pending3 beds 2 baths1,368 sq. ft.
10713 Jenkins Circle, Soddy Daisy, TN 37379
MLS# 1531081Listed by: EXP REALTY, LLC- New
 $1,950,000Active4 beds 4 baths3,957 sq. ft.
5426 Summerfield Lane, Signal Mountain, TN 37377
MLS# 1531084Listed by: KELLER WILLIAMS SUMMIT REALTY - New
 $275,000Active1 beds 1 baths699 sq. ft.
782 Riverfront Parkway #419, Chattanooga, TN 37402
MLS# 1531085Listed by: REAL ESTATE PARTNERS CHATTANOOGA LLC - New
 $359,000Active3 beds 3 baths1,332 sq. ft.
2439 Twill Place, Chattanooga, TN 37404
MLS# 3159429Listed by: PARKSIDE REALTY, LLC - Open Sun, 2 to 4pmNew
 $585,000Active4 beds 3 baths2,802 sq. ft.
6567 Satjanon Drive, Ooltewah, TN 37363
MLS# 1531071Listed by: KELLER WILLIAMS REALTY - New
 $414,900Active4 beds 3 baths2,565 sq. ft.
1465 Centerstone Lane, Apison, TN 37302
MLS# 1531076Listed by: SDH CHATTANOOGA LLC - New
 $375,000Active3 beds 3 baths1,332 sq. ft.
2431 Twill Place, Chattanooga, TN 37404
MLS# 1531079Listed by: PARKSIDE REALTY - New
 $375,000Active3 beds 3 baths1,332 sq. ft.
2423 Twill Place, Chattanooga, TN 37404
MLS# 3159423Listed by: PARKSIDE REALTY, LLC - New
 $850,000Active4 beds 5 baths4,209 sq. ft.
403 Dunsinane Road, Signal Mountain, TN 37377
MLS# 3159424Listed by: GREATER DOWNTOWN REALTY DBA KELLER WILLIAMS REALTY - Open Sun, 2 to 4pm
 $399,900Active3 beds 3 baths2,185 sq. ft.
6895 Bucksland Drive, Ooltewah, TN 37363
MLS# 1529405Listed by: THE SOURCE REAL ESTATE GROUP - New
 $375,000Active3 beds 3 baths1,800 sq. ft.
109 Rolling Ridge Drive, Chattanooga, TN 37421
MLS# 1529845Listed by: BERKSHIRE HATHAWAY HOMESERVICES J DOUGLAS PROPERTIES - New
 $465,000Active4 beds 3 baths2,153 sq. ft.
8651 Keystone Circle, Chattanooga, TN 37421
MLS# 1531060Listed by: RE/MAX RENAISSANCE REALTORS - New
 $51,000Active0.57 Acres
1720 Spring View Lane, Chattanooga, TN 37421
MLS# 1531062Listed by: KELLER WILLIAMS REALTY - New
 $500,000Active0 Acres
0 Whitehall Road #(Lot 2), Chattanooga, TN 37405
MLS# 1531064Listed by: REAL ESTATE PARTNERS CHATTANOOGA LLC - New
 $425,000Active0 Acres
0 Whitehall Road #(Lot 3), Chattanooga, TN 37405
MLS# 1531066Listed by: REAL ESTATE PARTNERS CHATTANOOGA LLC - New
 $375,000Active3 beds 3 baths1,800 sq. ft.
109 Rolling Ridge Drive, Chattanooga, TN 37421
MLS# 20261522Listed by: BERKSHIRE HATHAWAY J DOUGLAS PROPERTIES - New
 $388,000Active3 beds 3 baths2,000 sq. ft.
7738 Pinewood Drive, Chattanooga, TN 37421
MLS# 1531050Listed by: FLYNN REALTY - Coming Soon
 $615,000Coming Soon5 beds 5 baths
5848 N Park Road, Hixson, TN 37343
MLS# 3158909Listed by: GREATER DOWNTOWN REALTY DBA KELLER WILLIAMS REALTY - New
 $314,900Active3 beds 2 baths1,364 sq. ft.
2510 Standifer Oaks Road, Chattanooga, TN 37421
MLS# 1530745Listed by: KELLER WILLIAMS REALTY - Open Fri, 4 to 6pm
 $349,900Pending4 beds 3 baths2,150 sq. ft.
5701 Knotty Pine Drive, Ooltewah, TN 37363
MLS# 1530983Listed by: REALTY ONE GROUP EXPERTS - New
 $499,000Active5 beds 4 baths2,100 sq. ft.
1228 Sholar Avenue, Chattanooga, TN 37406
MLS# 1531044Listed by: VERIDICAL REALTY, LLC - New
 $380,000Active5 beds 3 baths2,776 sq. ft.
483 King Crest Lane, Hixson, TN 37343
MLS# 1531038Listed by: RE/MAX RENAISSANCE REALTORS - New
 $325,000Active3 beds 2 baths1,214 sq. ft.
2234 N Fork Drive, Soddy Daisy, TN 37379
MLS# 1531041Listed by: EXP REALTY,LLC - Open Sun, 2 to 4pmNew
 $575,000Active4 beds 3 baths2,737 sq. ft.
924 Traditions Drive, Chattanooga, TN 37415
MLS# 1531042Listed by: KELLER WILLIAMS REALTY - New
 $479,999Active-- beds -- baths1,624 sq. ft.
615 Colville Street #A, B, & C, Chattanooga, TN 37405
MLS# 1531027Listed by: COLDWELL BANKER KINARD COMMERCIAL - New
 $414,900Active5 beds 3 baths2,565 sq. ft.
1437 Centerstone Lane, Apison, TN 37302
MLS# 1531032Listed by: SDH CHATTANOOGA LLC - New
 $474,999Active3 beds 2 baths1,529 sq. ft.
2589 Avalon Circle, Chattanooga, TN 37415
MLS# 20261511Listed by: CRYE-LEIKE REALTORS - CLEVELAND - New
 $145,000Active2 beds 2 baths950 sq. ft.
900 Mountain Creek Road #Apt C43, Chattanooga, TN 37405
MLS# 1531022Listed by: BLUE KEY PROPERTIES LLC - New
 $619,900Active4 beds 4 baths2,773 sq. ft.
11401 Herons Hvn Drive #80, Soddy Daisy, TN 37379
MLS# 1531016Listed by: PRATT HOMES, LLC - Open Sun, 2 to 4pmNew
 $415,000Active3 beds 3 baths1,860 sq. ft.
6667 Dharma Lp, East Ridge, TN 37412
MLS# 1531017Listed by: KELLER WILLIAMS REALTY - New
 $51,000Active0.72 Acres
1728 Spring View Lane, Chattanooga, TN 37421
MLS# 1531018Listed by: KELLER WILLIAMS REALTY - New
 $249,900Active3 beds 2 baths1,400 sq. ft.
8403 Summers Park Lane, Soddy Daisy, TN 37379
MLS# 1531019Listed by: CRYE-LEIKE, REALTORS - New
 $298,750Active58.55 Acres
102 Swimming Deer Lot 14b, Graysville, TN 37338
MLS# 3158837Listed by: TENNESSEE REAL ESTATE PROS  $75,000Pending2 beds 2 baths860 sq. ft.
1701 Stanfiel Street, Chattanooga, TN 37406
MLS# 1531000Listed by: KELLER WILLIAMS REALTY- New
 $395,000Active3 beds 3 baths2,097 sq. ft.
6424 Serenade Lane, Hixson, TN 37343
MLS# 1530999Listed by: CRYE-LEIKE, REALTORS - New
 $375,000Active3 beds 3 baths2,190 sq. ft.
6937 Bucksland Drive, Ooltewah, TN 37363
MLS# 1531001Listed by: OPENDOOR BROKERAGE LLC - New
 $165,000Active1.66 Acres
935 Bluff Ledge Trail, Hixson, TN 37343
MLS# 1531004Listed by: RE/MAX RENAISSANCE REALTORS - New
 $2,295,000Active-- beds -- baths1,596 sq. ft.
520 S Holly Street, Chattanooga, TN 37404
MLS# 1531005Listed by: 5H REALTY SERVICES, LLC - Open Fri, 1 to 4pmNew
 $250,000Active3 beds 2 baths1,150 sq. ft.
2628 N Beech Street, Chattanooga, TN 37406
MLS# 1530994Listed by: ROGUE REAL ESTATE COMPANY LLC - Open Sun, 2 to 4pmNew
 $315,000Active3 beds 3 baths1,800 sq. ft.
1707 Rivergate Terrace, Soddy Daisy, TN 37379
MLS# 1530996Listed by: KELLER WILLIAMS REALTY - New
 $275,000Active3 beds 2 baths1,450 sq. ft.
2112 E 14th Street, Chattanooga, TN 37404
MLS# 1530997Listed by: KELLER WILLIAMS REALTY - New
 $330,000Active4 beds 2 baths1,500 sq. ft.
6008 Fisk Avenue, Chattanooga, TN 37421
MLS# 3158722Listed by: REAL BROKER - New
 $485,000Active5 beds 4 baths3,096 sq. ft.
1861 Abington Farms Way, Hixson, TN 37343
MLS# 20261499Listed by: COLDWELL BANKER KINARD REALTY - New
 $2,700,000Active3.8 Acres
8080 Old Cleveland Pike, Ooltewah, TN 37363
MLS# 1530989Listed by: RE/MAX RENAISSANCE REALTORS  $449,777Pending2 beds 3 baths1,471 sq. ft.
229 W 17th Street, Chattanooga, TN 37408
MLS# 1530990Listed by: REAL ESTATE PARTNERS CHATTANOOGA LLC $635,000Active4 beds 3 baths2,016 sq. ft.
347 Tucker Street, Chattanooga, TN 37405
MLS# 1530122Listed by: KELLER WILLIAMS REALTY $625,000Pending4 beds 3 baths3,144 sq. ft.
8041 Rosemere Way, Chattanooga, TN 37421
MLS# 1530400Listed by: 1 PERCENT LISTS SCENIC CITY- Open Sun, 2 to 4pmNew
 $725,000Active4 beds 3 baths3,548 sq. ft.
1473 Jays Court, Soddy Daisy, TN 37379
MLS# 1530571Listed by: KELLER WILLIAMS REALTY - New
 $465,000Active3 beds 2 baths1,705 sq. ft.
6914 Star Lite, Hixson, TN 37343
MLS# 1530641Listed by: CRYE-LEIKE, REALTORS - New
 $139,000Active4 beds 2 baths1,122 sq. ft.
409 E 52nd Street, Chattanooga, TN 37410
MLS# 1530986Listed by: CRYE-LEIKE, REALTORS - New
 $105,000Active1.77 Acres
8627 Brow Lake Rd, Soddy-Daisy, TN 37379
MLS# 1333834Listed by: WALLACE - New
 $599,000Active6 beds 4 baths3,228 sq. ft.
8106 Savannah Bay Drive, Ooltewah, TN 37363
MLS# 1530981Listed by: ZACH TAYLOR - CHATTANOOGA - New
 $219,000Active3 beds 2 baths1,256 sq. ft.
6118 Vance Circle, Chattanooga, TN 37421
MLS# 1530969Listed by: ROCK POINT REAL ESTATE - New
 $355,000Active4 beds 2 baths1,665 sq. ft.
3409 Anderson Pike, Signal Mountain, TN 37377
MLS# 1530970Listed by: KELLER WILLIAMS REALTY - New
 $579,000Active4 beds 3 baths2,382 sq. ft.
7119 Paxton Circle, Hixson, TN 37343
MLS# 20261492Listed by: THE GROUP REAL ESTATE BROKERAGE - New
 $190,000Active2 beds 1 baths1,010 sq. ft.
5422 Clemons Road, Chattanooga, TN 37412
MLS# 1530948Listed by: RICHARDSON GROUP - New
 $385,000Active-- beds -- baths3,378 sq. ft.
107 Hollyberry Lane, Chattanooga, TN 37411
MLS# 1530957Listed by: KELLER WILLIAMS REALTY - New
 $300,000Active3 beds 1 baths1,161 sq. ft.
327 Shanty Lake Drive, Chattanooga, TN 37419
MLS# 1530958Listed by: 1 PERCENT LISTS SCENIC CITY - New
 $315,000Active3 beds 3 baths1,746 sq. ft.
3735 Thrushwood Drive, Chattanooga, TN 37415
MLS# 1530961Listed by: BERKSHIRE HATHAWAY HOMESERVICES J DOUGLAS PROPERTIES - New
 $239,000Active3 beds 2 baths1,162 sq. ft.
4805 Arrowhead Trail, Chattanooga, TN 37411
MLS# 1530944Listed by: RE/MAX PROPERTIES - New
 $420,000Active3 beds 3 baths1,870 sq. ft.
2479 Baskette Way, Chattanooga, TN 37421
MLS# 1530946Listed by: REAL ESTATE PARTNERS CHATTANOOGA LLC - New
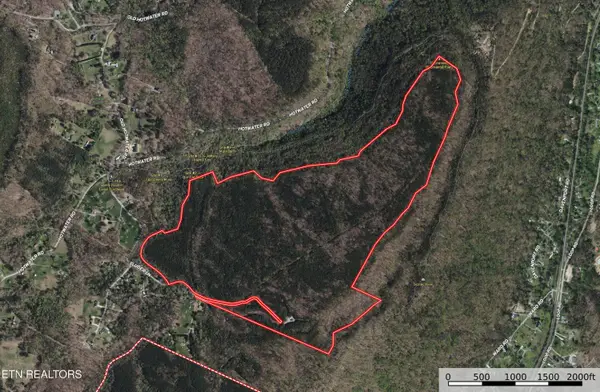
 $2,800,000Active60.1 Acres
0 Hotwater Road, Soddy Daisy, TN 37379
MLS# 3156492Listed by: REAL BROKER - New
 $1,000,000Active0.58 Acres
4971 Lillie Lane, Ooltewah, TN 37363
MLS# 3156524Listed by: BERKSHIRE HATHAWAY HOMESERVICES J DOUGLAS PROP. - New
 $2,500,000Active5 beds 7 baths6,235 sq. ft.
8269 Balata Drive, Ooltewah, TN 37363
MLS# 1530941Listed by: REAL ESTATE PARTNERS CHATTANOOGA LLC - New
 $1,167,000Active46.7 Acres
13649 Eldridge Road, Birchwood, TN 37308
MLS# 20261481Listed by: KELLER WILLIAMS REALTY - CHATTANOOGA - LEE HWY - New
 $399,900Active4 beds 3 baths2,774 sq. ft.
4012 Rogers Road, Chattanooga, TN 37411
MLS# 1530923Listed by: KELLER WILLIAMS REALTY - Open Sat, 1 to 3pmNew
 $374,900Active3 beds 2 baths2,108 sq. ft.
8715 Windhaven Road, Ooltewah, TN 37363
MLS# 1530927Listed by: RE/MAX RENAISSANCE REALTORS - New
 $1,100,000Active3 beds 5 baths3,397 sq. ft.
3059 Rivermont Road, Chattanooga, TN 37415
MLS# 1530929Listed by: WILLIAMS & WILLIAMS REALTY SERVICES - New
 $144,900Active2 beds 2 baths950 sq. ft.
900 Mountain Creek Road # 109, Chattanooga, TN 37405
MLS# 3156315Listed by: GREATER DOWNTOWN REALTY DBA KELLER WILLIAMS REALTY - New
 $419,000Active2 beds 2 baths1,899 sq. ft.
861 Carlisle Lane, Chattanooga, TN 37405
MLS# 3156159Listed by: RE/MAX PROPERTIES - New
 $340,000Active3 beds 2 baths1,429 sq. ft.
6061 Veronica Drive, Ooltewah, TN 37363
MLS# 20261474Listed by: EXP REALTY, LLC - Open Sun, 3 to 5pmNew
 $825,000Active4 beds 4 baths2,934 sq. ft.
1908 Clear Brooks Drive, Signal Mountain, TN 37377
MLS# 1530848Listed by: KELLER WILLIAMS REALTY 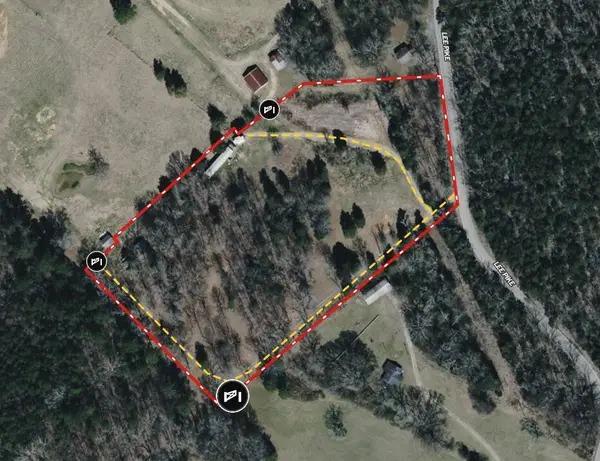 $249,000Pending7.18 Acres
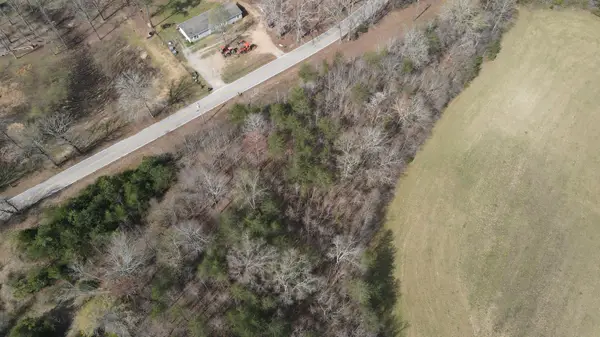
2663 Lee Pike, Soddy-Daisy, TN 37379
MLS# 20261469Listed by: SMALLTOWN HUNTING PROPERTIES & REAL ESTATE, LLC- New
 $59,000Active1.5 Acres
0 Black Oak Road, Sale Creek, TN 37373
MLS# 20261468Listed by: SMALLTOWN HUNTING PROPERTIES & REAL ESTATE, LLC 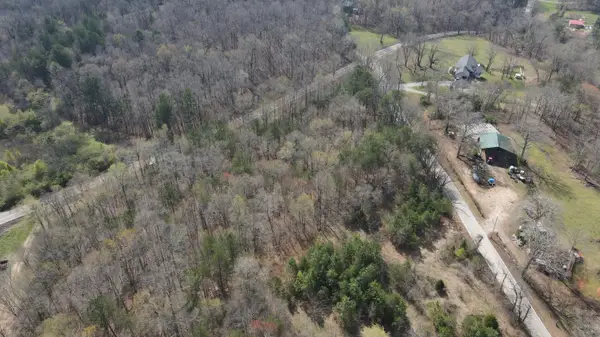 $69,000Pending3.4 Acres
0 Andy Thomas Road, Sale Creek, TN 37373
MLS# 20261470Listed by: SMALLTOWN HUNTING PROPERTIES & REAL ESTATE, LLC- New
 $299,000Active3 beds 2 baths1,536 sq. ft.
2806 Fairmount Pike, Signal Mountain, TN 37377
MLS# 1530912Listed by: KELLER WILLIAMS REALTY - New
 $317,500Active3 beds 2 baths1,847 sq. ft.
902 Lindsay Avenue, Chattanooga, TN 37421
MLS# 1530907Listed by: KELLER WILLIAMS REALTY - Open Sun, 2am to 4pmNew
 $564,900Active3 beds 3 baths2,543 sq. ft.
6245 Cashmere Lane, Harrison, TN 37341
MLS# 1530751Listed by: KELLER WILLIAMS REALTY  $419,900Pending3 beds 2 baths1,840 sq. ft.
7419 Private Lane, Ooltewah, TN 37363
MLS# 1530899Listed by: THE SOURCE REAL ESTATE GROUP- New
 $594,000Active4 beds 3 baths2,700 sq. ft.
1685 Storyvale Lane, Hixson, TN 37343
MLS# 1530903Listed by: GREENTECH HOMES LLC - New
 $550,000Active0 Acres
497 Wayne Avenue #(Lot 1), Chattanooga, TN 37405
MLS# 1530898Listed by: REAL ESTATE PARTNERS CHATTANOOGA LLC - New
 $664,599Active5 beds 3 baths3,500 sq. ft.
135 Palisades Drive, Signal Mountain, TN 37377
MLS# 1333642Listed by: HOMECOIN.COM - New
 $249,000Active3 beds 1 baths1,565 sq. ft.
1100 Tunnel Boulevard, Chattanooga, TN 37411
MLS# 1530882Listed by: VERIDICAL REALTY, LLC - New
 $119,900Active5.45 Acres
4749 Parker Loop Road, Birchwood, TN 37308
MLS# 1530868Listed by: EXP REALTY LLC - New
 $399,000Active4 beds 3 baths2,188 sq. ft.
9015 Potomac Drive, Chattanooga, TN 37421
MLS# 1530873Listed by: REAL ESTATE PARTNERS CHATTANOOGA LLC  $339,900Pending3 beds 2 baths1,285 sq. ft.
4408 James Drive, Chattanooga, TN 37416
MLS# 1530875Listed by: PREMIER PROPERTY GROUP INC.- New
 $265,000Active3 beds 3 baths1,502 sq. ft.
1102 Collins Circle, Chattanooga, TN 37411
MLS# 1530878Listed by: THE SOURCE REAL ESTATE GROUP - New
 $389,900Active2 beds 2 baths1,543 sq. ft.
1587 Whisper Winds Lane #40, Ooltewah, TN 37363
MLS# 1530880Listed by: PRATT HOMES, LLC - New
 $468,900Active4 beds 3 baths2,200 sq. ft.
31 Storyvale Lane Lane, Hixson, TN 37343
MLS# 1530881Listed by: GREENTECH HOMES LLC - New
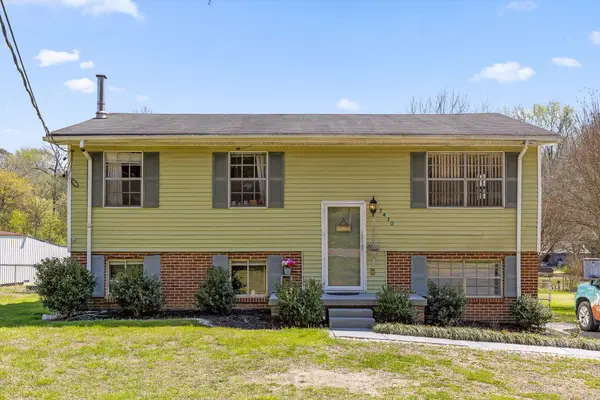 $315,000Active4 beds 2 baths1,640 sq. ft.
7410 S Dent Road, Middle Valley, TN 37343
MLS# 20261452Listed by: BERKSHIRE HATHAWAY J DOUGLAS PROPERTIES - Open Sun, 2 to 4pmNew
 $699,000Active3 beds 2 baths2,139 sq. ft.
55 E Main #208, Chattanooga, TN 37408
MLS# 1530871Listed by: BEYCOME BROKERAGE REALTY LLC - Open Sun, 2 to 4pmNew
 $232,000Active3 beds 2 baths1,200 sq. ft.
1317 Vance Road, Chattanooga, TN 37421
MLS# 1530867Listed by: WEICHERT REALTORS-THE SPACE PLACE - New
 $1,200,000Active3 beds 3 baths2,686 sq. ft.
215 Mcfarland Avenue, Chattanooga, TN 37405
MLS# 3155481Listed by: GREATER DOWNTOWN REALTY DBA KELLER WILLIAMS REALTY - New
 $375,000Active4 beds 3 baths1,700 sq. ft.
7014 S Dent Road, Hixson, TN 37343
MLS# 1530580Listed by: KELLER WILLIAMS REALTY - New
 $995,000Active4 beds 4 baths4,187 sq. ft.
7378 Chimney Rock Trail, Signal Mountain, TN 37377
MLS# 1530593Listed by: KELLER WILLIAMS REALTY - New
 $430,000Active2 beds 2 baths1,492 sq. ft.
1213 Bridgewater Lane, Chattanooga, TN 37405
MLS# 1530600Listed by: KELLER WILLIAMS REALTY - New
 $699,000Active3 beds 4 baths3,180 sq. ft.
2600 Brown Ridge Lane, Hixson, TN 37343
MLS# 1530865Listed by: KELLER WILLIAMS REALTY - New
 $1,395,000Active4 beds 5 baths3,770 sq. ft.
1817 Notting Hill, Chattanooga, TN 37405
MLS# 1530866Listed by: REAL ESTATE PARTNERS CHATTANOOGA LLC - New
 $430,000Active3 beds 3 baths2,192 sq. ft.
8616 River Cove Drive, Harrison, TN 37341
MLS# 1530864Listed by: KELLER WILLIAMS REALTY - New
 $391,600Active3 beds 2 baths1,958 sq. ft.
10211 Stellata Lane, Apison, TN 37302
MLS# 3155837Listed by: REAL ESTATE PARTNERS CHATTANOOGA, LLC - New
 $499,900Active2 beds 2 baths1,323 sq. ft.
1414 Continental Drive #906, Chattanooga, TN 37405
MLS# 1530860Listed by: RE/MAX PROPERTIES - New
 $649,000Active3 beds 2 baths2,028 sq. ft.
6857 Sam Smith Road, Birchwood, TN 37308
MLS# 3155818Listed by: GREATER CHATTANOOGA REALTY, KELLER WILLIAMS REALTY - New
 $539,900Active4 beds 4 baths3,070 sq. ft.
603 Hurricane Creek Road, Chattanooga, TN 37421
MLS# 1530859Listed by: RE/MAX PROPERTIES - New
 $775,000Active5 beds 3 baths3,081 sq. ft.
707 Windy Way, Signal Mountain, TN 37377
MLS# 1530849Listed by: REAL ESTATE PARTNERS CHATTANOOGA LLC - New
 $385,000Active3 beds 2 baths2,203 sq. ft.
719 Belvoir Avenue, East Ridge, TN 37412
MLS# 1530850Listed by: SABRENA REALTY ASSOCIATES LLC  $415,000Pending3 beds 2 baths1,695 sq. ft.
10206 Nissi Way, Soddy Daisy, TN 37379
MLS# 1530851Listed by: ZACH TAYLOR - CHATTANOOGA- New
 $825,000Active4 beds 4 baths2,754 sq. ft.
11548 Armstrong Road, Soddy Daisy, TN 37379
MLS# 1530854Listed by: KELLER WILLIAMS REALTY - New
 $189,900Active2.16 Acres
2221 Horizons Drive, Ooltewah, TN 37363
MLS# 1530837Listed by: KELLER WILLIAMS REALTY - New
 $849,999Active6 beds 4 baths3,500 sq. ft.
7833 Stonehenge Drive, Chattanooga, TN 37421
MLS# 1530838Listed by: PREMIER PROPERTY GROUP INC. - Open Sun, 2 to 4pmNew
 $555,000Active4 beds 3 baths1,967 sq. ft.
1123 Coker Circle, Chattanooga, TN 37415
MLS# 1530840Listed by: HORIZON SOTHEBY'S INTERNATIONAL REALTY - New
 $390,000Active3 beds 2 baths1,558 sq. ft.
916 Canebreak Drive, Chattanooga, TN 37415
MLS# 1530829Listed by: EXP REALTY LLC - New
 $370,000Active3 beds 2 baths2,173 sq. ft.
307 Guild Drive, Chattanooga, TN 37421
MLS# 1530832Listed by: REAL BROKER - New
 $110,000Active5 beds 2 baths1,566 sq. ft.
901 Wheeler Avenue, Chattanooga, TN 37406
MLS# 1530833Listed by: EXP REALTY, LLC - New
 $550,000Active3 beds 2 baths1,656 sq. ft.
7931 Short Tail Springs Road, Ooltewah, TN 37363
MLS# 1530835Listed by: KELLER WILLIAMS REALTY  $28,000Pending0.17 Acres
0 Rotary Drive #Lot 30, Chattanooga, TN 37416
MLS# 1530817Listed by: KELLER WILLIAMS REALTY- New
 $350,000Active3 beds 2 baths2,058 sq. ft.
1322 Vanessa Drive, Hixson, TN 37343
MLS# 1530819Listed by: REAL ESTATE PARTNERS CHATTANOOGA LLC - Open Sat, 11am to 1pmNew
 $399,900Active4 beds 2 baths1,891 sq. ft.
1110 Panorama Drive, Chattanooga, TN 37421
MLS# 1530821Listed by: KELLER WILLIAMS REALTY - Open Sun, 2 to 4pmNew
 $299,999Active2 beds 2 baths1,175 sq. ft.
313 Callaway Court #313, Chattanooga, TN 37421
MLS# 1530822Listed by: CRYE-LEIKE, REALTORS - New
 $699,000Active3 beds 3 baths3,638 sq. ft.
11615 Mcghee Road, Apison, TN 37302
MLS# 1530823Listed by: LEGACY 234 - New
 $299,900Active2 beds 2 baths896 sq. ft.
896 Foxtail Drive, Chattanooga, TN 37421
MLS# 1530825Listed by: LEGACY SOUTH BROKERAGE, LLC - New
 $330,000Active2 beds 1 baths1,128 sq. ft.
4200 Crestview Drive, Chattanooga, TN 37415
MLS# 3155520Listed by: BERKSHIRE HATHAWAY HOMESERVICES J DOUGLAS PROP. - New
 $299,000Active1 beds 1 baths1,075 sq. ft.
1131 Stringers Ridge Road #15 K, Chattanooga, TN 37405
MLS# 1530795Listed by: UNITED REAL ESTATE EXPERTS - New
 $485,000Active3 beds 3 baths2,394 sq. ft.
9306 W Ridge Trail Road, Soddy Daisy, TN 37379
MLS# 1530797Listed by: KELLER WILLIAMS REALTY  $199,000Pending1.16 Acres
6529 Shelter Cove Drive, Hixson, TN 37343
MLS# 1530798Listed by: KELLER WILLIAMS REALTY- New
 $449,900Active3 beds 2 baths1,900 sq. ft.
41 Snow Line Lane, Ooltewah, TN 37363
MLS# 1530799Listed by: GREENTECH HOMES LLC - New
 $699,700Active4 beds 3 baths2,874 sq. ft.
4620 Saint Elmo Avenue, Chattanooga, TN 37409
MLS# 1530801Listed by: THE GROUP REAL ESTATE BROKERAGE - New
 $315,000Active3 beds 2 baths1,794 sq. ft.
7629 Walnut Hills Drive, Harrison, TN 37341
MLS# 1530803Listed by: OAK AND WILLOWS REAL ESTATE COLLECTIVE PLLC - New
 $300,000Active3 beds 2 baths1,689 sq. ft.
350 Camp Jordan Road, Chattanooga, TN 37412
MLS# 1530804Listed by: KELLER WILLIAMS REALTY - New
 $465,000Active2 beds 2 baths1,584 sq. ft.
737 Miller Cove Road, Signal Mountain, TN 37377
MLS# 1530805Listed by: CRYE-LEIKE, REALTORS - New
 $310,000Active2 beds 2 baths1,344 sq. ft.
8850 James Crk Drive #Lot 65, Ooltewah, TN 37363
MLS# 1530810Listed by: KELLER WILLIAMS REALTY - New
 $525,000Active3 beds 2 baths2,158 sq. ft.
6927 Flagstone Drive, Ooltewah, TN 37363
MLS# 1530812Listed by: REAL ESTATE PARTNERS CHATTANOOGA LLC - New
 $535,000Active4 beds 3 baths2,506 sq. ft.
3544 Morning Dew Cove, Apison, TN 37302
MLS# 1530813Listed by: BETTER HOMES AND GARDENS REAL ESTATE SIGNATURE BROKERS  $1,300,000Pending4 beds 4 baths3,751 sq. ft.
1213 Altamont Road, Chattanooga, TN 37415
MLS# 1530814Listed by: REAL AGENTS REALTY COMPANY- New
 $385,000Active3 beds 2 baths2,087 sq. ft.
7194 British Road, Ooltewah, TN 37363
MLS# 3155406Listed by: REAL ESTATE PARTNERS CHATTANOOGA, LLC - Open Sun, 1 to 3pmNew
 $499,900Active4 beds 3 baths2,457 sq. ft.
7925 Frostwood Lane, Ooltewah, TN 37363
MLS# 3155409Listed by: REAL ESTATE PARTNERS CHATTANOOGA, LLC - New
 $425,000Active3 beds 2 baths1,665 sq. ft.
4610 Tennessee Avenue, Chattanooga, TN 37409
MLS# 3155416Listed by: EXP REALTY - New
 $575,000Active3 beds 4 baths1,964 sq. ft.
1705 Adams Street, Chattanooga, TN 37408
MLS# 3155325Listed by: UNITED REAL ESTATE EXPERTS - New
 $674,900Active5 beds 4 baths3,120 sq. ft.
4329 Brush Creek Court, Apison, TN 37302
MLS# 1530782Listed by: KELLER WILLIAMS REALTY - New
 $385,000Active4 beds 2 baths2,327 sq. ft.
208 Buena Vista Drive, Chattanooga, TN 37404
MLS# 1530789Listed by: EXP REALTY, LLC - New
 $339,000Active3 beds 3 baths1,515 sq. ft.
5398 Reneau Way, Chattanooga, TN 37412
MLS# 1530790Listed by: EXP REALTY LLC  $299,000Pending3 beds 2 baths1,200 sq. ft.
1332 Koblan Drive, Hixson, TN 37343
MLS# 1530793Listed by: KELLER WILLIAMS REALTY- New
 $317,500Active2 beds 2 baths1,588 sq. ft.
118 Shearer Street, Soddy Daisy, TN 37379
MLS# 1530794Listed by: KELLER WILLIAMS REALTY - New
 $400,000Active3 beds 2 baths1,678 sq. ft.
5720 Saint Elmo Avenue, Chattanooga, TN 37409
MLS# 1530768Listed by: REAL BROKER - New
 $335,000Active1 beds 1 baths779 sq. ft.
804 Riverfront Parkway #302, Chattanooga, TN 37402
MLS# 1530769Listed by: REAL ESTATE PARTNERS CHATTANOOGA LLC  $374,000Pending2 beds 1 baths864 sq. ft.
801 Albany Street, Chattanooga, TN 37405
MLS# 1530772Listed by: KELLER WILLIAMS REALTY- Open Sun, 2 to 4pmNew
 $1,390,000Active5 beds 4 baths3,753 sq. ft.
903 Channel View Lane, Chattanooga, TN 37415
MLS# 1530775Listed by: REAL ESTATE PARTNERS CHATTANOOGA LLC  $365,000Active4 beds 3 baths1,860 sq. ft.
8121 Zoe Drive, Ooltewah, TN 37363
MLS# 1529211Listed by: KELLER WILLIAMS REALTY $230,000Active-- beds -- baths1,560 sq. ft.
3626 Tanaka Trail #3626/3628, Chattanooga, TN 37404
MLS# 1529438Listed by: COLDWELL BANKER PRYOR REALTY $609,500Pending4 beds 4 baths2,640 sq. ft.
9205 Scarlet Ridge, Ooltewah, TN 37363
MLS# 1530500Listed by: REAL AGENTS REALTY COMPANY $275,000Pending3 beds 2 baths1,400 sq. ft.
10940 Eustice Road, Soddy Daisy, TN 37379
MLS# 1530542Listed by: ZACH TAYLOR - CHATTANOOGA- New
 $525,000Active4 beds 3 baths2,170 sq. ft.
4717 Hawk Den Trail, Chattanooga, TN 37415
MLS# 1530767Listed by: LOCAL ROOTS REALTY - New
 $525,000Active5 beds 4 baths2,877 sq. ft.
5542 Ginkgo Road, Ooltewah, TN 37363
MLS# 1530761Listed by: DAVANZO REAL ESTATE - Open Sun, 12 to 3pmNew
 $989,000Active3 beds 3 baths2,200 sq. ft.
10245 Snow Hill Road, Ooltewah, TN 37363
MLS# 1530765Listed by: ZACH TAYLOR - CHATTANOOGA - Open Sat, 12 to 2pmNew
 $520,000Active3 beds 2 baths2,213 sq. ft.
555 Deer Valley Drive, Hixson, TN 37343
MLS# 3155143Listed by: REAL ESTATE PARTNERS CHATTANOOGA, LLC  $440,000Pending4 beds 3 baths2,346 sq. ft.
6523 Shallowmar Lane, Hixson, TN 37343
MLS# 1530749Listed by: KELLER WILLIAMS REALTY- New
 $319,999Active3 beds 2 baths1,100 sq. ft.
2202 Duncan Avenue, Chattanooga, TN 37404
MLS# 1530753Listed by: LPT REALTY LLC - New
 $239,999Active-- beds -- baths1,600 sq. ft.
1703 Bailey Avenue, Chattanooga, TN 37404
MLS# 1530754Listed by: CRYE-LEIKE, REALTORS - New
 $545,000Active3 beds 3 baths1,992 sq. ft.
229 Delmont Street #259, Chattanooga, TN 37405
MLS# 3155122Listed by: ZACH TAYLOR CHATTANOOGA - Open Sun, 2 to 4pmNew
 $479,000Active3 beds 2 baths2,276 sq. ft.
9711 Imperial Drive, Ooltewah, TN 37363
MLS# 1530522Listed by: KELLER WILLIAMS REALTY - New
 $539,000Active-- beds -- baths4,320 sq. ft.
3950 Arbor Pl Lane, Chattanooga, TN 37416
MLS# 1530738Listed by: KELLER WILLIAMS REALTY  $110,000Pending3 beds 2 baths1,148 sq. ft.
7036 Maplewood Lane, Chattanooga, TN 37419
MLS# 1530750Listed by: SIMPLIHOM- New
 $205,000Active3 beds 2 baths924 sq. ft.
146 Snyder Loop Rd, Graysville, TN 37338
MLS# 1333367Listed by: EXP REALTY, LLC - New
 $365,000Active3 beds 3 baths1,512 sq. ft.
5412 Dorsey Street, Chattanooga, TN 37410
MLS# 3152930Listed by: GREATER CHATTANOOGA REALTY, KELLER WILLIAMS REALTY - New
 $330,000Active3 beds 2 baths1,423 sq. ft.
5414 Dorsey Street, Chattanooga, TN 37410
MLS# 3152932Listed by: GREATER CHATTANOOGA REALTY, KELLER WILLIAMS REALTY - New
 $765,000Active5 beds 4 baths3,616 sq. ft.
4007 Anderson Pike, Signal Mountain, TN 37377
MLS# 3154935Listed by: REAL ESTATE PARTNERS CHATTANOOGA, LLC - New
 $475,000Active4 beds 3 baths2,148 sq. ft.
7094 Homestead Circle, Hixson, TN 37343
MLS# 3154940Listed by: REAL ESTATE PARTNERS CHATTANOOGA, LLC - Open Sun, 1 to 3pmNew
 $635,000Active4 beds 4 baths3,456 sq. ft.
6524 Turner Ashby Drive, Hixson, TN 37343
MLS# 3154963Listed by: EXP REALTY - New
 $387,400Active4 beds 2 baths1,474 sq. ft.
719 Donaldson Road, Chattanooga, TN 37412
MLS# 1530623Listed by: KELLER WILLIAMS REALTY - New
 $350,000Active4 beds 2 baths1,952 sq. ft.
9329 Wyndover Drive, Chattanooga, TN 37421
MLS# 1530728Listed by: LPT REALTY LLC - Open Sun, 1 to 3pmNew
 $389,000Active2 beds 2 baths1,662 sq. ft.
408 Renaissance Court, Chattanooga, TN 37419
MLS# 1530729Listed by: ZACH TAYLOR - CHATTANOOGA  $720,000Pending3 beds 3 baths1,974 sq. ft.
21 Oliver Court, Signal Mountain, TN 37377
MLS# 1530730Listed by: REAL ESTATE PARTNERS CHATTANOOGA LLC $210,000Pending3 beds 2 baths1,196 sq. ft.
1910 Tombras Avenue, Chattanooga, TN 37412
MLS# 1530731Listed by: KELLER WILLIAMS REALTY- New
 $275,000Active4 beds 2 baths2,176 sq. ft.
4024 Smith Lane, Ooltewah, TN 37363
MLS# 1530714Listed by: LPT REALTY LLC - New
 $584,000Active2 beds 2 baths1,225 sq. ft.
200 Manufacturers Road #Apt 407, Chattanooga, TN 37405
MLS# 1530716Listed by: EXIT REALTY  $275,000Pending4 beds 3 baths1,648 sq. ft.
3000 Mary Walker Place, Chattanooga, TN 37411
MLS# 1530717Listed by: WORKING MOMS REALTY LLC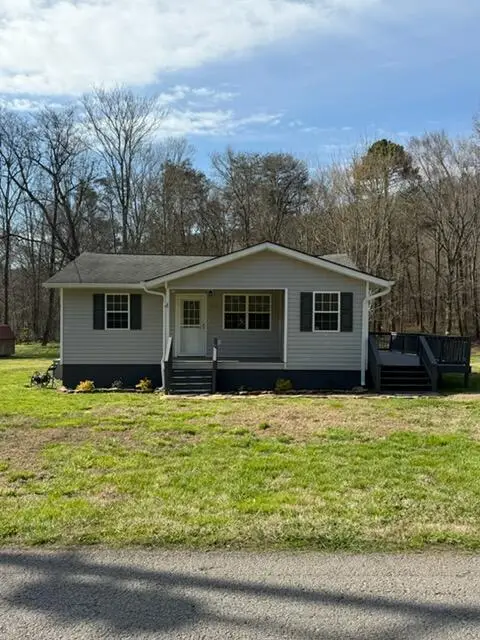 $172,000Pending2 beds 1 baths816 sq. ft.
1663 Pikeville Avenue, Graysville, TN 37338
MLS# 20261409Listed by: SIMPLIHOM- Open Sun, 1 to 3pmNew
 $965,000Active3 beds 3 baths3,034 sq. ft.
2418 Mowbray Pike, Soddy Daisy, TN 37379
MLS# 1530710Listed by: REAL ESTATE PARTNERS CHATTANOOGA LLC - New
 $399,000Active3 beds 2 baths1,798 sq. ft.
3200 Stage Run, Hixson, TN 37343
MLS# 1530713Listed by: KELLER WILLIAMS REALTY - New
 $324,900Active3 beds 3 baths1,450 sq. ft.
1848 Newell Avenue, Chattanooga, TN 37404
MLS# 3154805Listed by: BERKSHIRE HATHAWAY HOMESERVICES J DOUGLAS PROP. - New
 $324,900Active3 beds 3 baths1,450 sq. ft.
1850 Newell Avenue, Chattanooga, TN 37404
MLS# 3154806Listed by: BERKSHIRE HATHAWAY HOMESERVICES J DOUGLAS PROP. - New
 $324,900Active3 beds 3 baths1,450 sq. ft.
1846 Newell Avenue, Chattanooga, TN 37404
MLS# 3154807Listed by: BERKSHIRE HATHAWAY HOMESERVICES J DOUGLAS PROP. - New
 $361,545Active4 beds 2 baths1,497 sq. ft.
8477 Bright Water Dr, Ooltewah, TN 37363
MLS# 1530687Listed by: DHI INC - New
 $372,620Active3 beds 2 baths1,618 sq. ft.
8471 Bright Water Dr, Ooltewah, TN 37363
MLS# 1530692Listed by: DHI INC  $330,000Pending4 beds 3 baths1,644 sq. ft.
2410 Sunset Strip Street, Hixson, TN 37343
MLS# 1530694Listed by: RE/MAX PROPERTIES- New
 $1,650,000Active4 beds 4 baths3,102 sq. ft.
6422 Ware Branch Cove Drive, Harrison, TN 37341
MLS# 1530699Listed by: KELLER WILLIAMS REALTY - Open Sun, 1 to 3pmNew
 $520,000Active3 beds 3 baths2,824 sq. ft.
4517 Wellesley Drive, Ooltewah, TN 37363
MLS# 3153253Listed by: ZACH TAYLOR CHATTANOOGA - New
 $399,900Active4 beds 2 baths2,126 sq. ft.
833 Belvoir Hills Drive, Chattanooga, TN 37412
MLS# 3154688Listed by: REAL ESTATE PARTNERS CHATTANOOGA, LLC - New
 $369,960Active3 beds 2 baths1,618 sq. ft.
8478 Bright Water Dr, Ooltewah, TN 37363
MLS# 1530681Listed by: DHI INC - New
 $381,005Active4 beds 2 baths1,764 sq. ft.
8483 Bright Water Dr, Ooltewah, TN 37363
MLS# 1530684Listed by: DHI INC - New
 $375,265Active3 beds 3 baths1,749 sq. ft.
8472 Bright Water Dr, Ooltewah, TN 37363
MLS# 1530673Listed by: DHI INC - New
 $51,000Active0.78 Acres
1714 Spring View Lane, Chattanooga, TN 37421
MLS# 1530674Listed by: KELLER WILLIAMS REALTY  $51,000Pending0.7 Acres
1718 Spring View Lane, Chattanooga, TN 37421
MLS# 1530675Listed by: KELLER WILLIAMS REALTY- New
 $70,000Active0.34 Acres
0 Forest Drive, Collegedale, TN 37363
MLS# 1530677Listed by: KELLER WILLIAMS REALTY - Open Sun, 2 to 4pmNew
 $520,000Active3 beds 3 baths2,824 sq. ft.
4517 Wellesley Drive, Collegedale, TN 37363
MLS# 1530678Listed by: ZACH TAYLOR - CHATTANOOGA - New
 $120,000Active1.42 Acres
0 Moore Road, Collegedale, TN 37363
MLS# 1530680Listed by: KELLER WILLIAMS REALTY - New
 $259,900Active3 beds 2 baths1,512 sq. ft.
1647 S Seminole Drive, Chattanooga, TN 37412
MLS# 1530670Listed by: CRYE-LEIKE, REALTORS - Open Sun, 2 to 4pmNew
 $395,000Active3 beds 3 baths2,196 sq. ft.
215 Waheela Drive, Chattanooga, TN 37404
MLS# 1530667Listed by: SPROUSE REALTY AND AUCTION - New
 $749,900Active4 beds 4 baths2,694 sq. ft.
8938 Cattails Creek Way, Ooltewah, TN 37363
MLS# 1530668Listed by: THE SOURCE REAL ESTATE GROUP  $445,000Active4 beds 3 baths2,460 sq. ft.
6460 Winlerkorn Lane, Ooltewah, TN 37363
MLS# 1530035Listed by: EXP REALTY, LLC $975,000Pending6 beds 5 baths6,142 sq. ft.
9449 Windrose Circle, Chattanooga, TN 37421
MLS# 1530491Listed by: EXP REALTY, LLC $444,900Pending4 beds 3 baths2,138 sq. ft.
9034 Wood Dale Lane, Hixson, TN 37343
MLS# 1530568Listed by: BETTER HOMES AND GARDENS REAL ESTATE SIGNATURE BROKERS- New
 $245,000Active3 beds 2 baths1,404 sq. ft.
2600 Campbell Street, Chattanooga, TN 37406
MLS# 1530605Listed by: BETTER HOMES AND GARDENS REAL ESTATE SIGNATURE BROKERS - New
 $255,000Active2 beds 2 baths1,042 sq. ft.
7358 Old Cleveland Pike, Chattanooga, TN 37421
MLS# 1530657Listed by: KELLER WILLIAMS REALTY - New
 $29,900Active0.13 Acres
0 E 24th Street, Chattanooga, TN 37407
MLS# 3153162Listed by: GREATER CHATTANOOGA REALTY, KELLER WILLIAMS REALTY - New
 $985,000Active3 beds 3 baths3,390 sq. ft.
1977 Sitton Mills Place, Signal Mountain, TN 37377
MLS# 3153128Listed by: GREATER DOWNTOWN REALTY DBA KELLER WILLIAMS REALTY - New
 $299,000Active3 beds 2 baths1,400 sq. ft.
5005 Renezet Drive, Chattanooga, TN 37416
MLS# 1530656Listed by: REAL ESTATE 9, LLC - New
 $349,900Active2 beds 2 baths1,093 sq. ft.
209 W 16th Street, Chattanooga, TN 37408
MLS# 3153114Listed by: REAL ESTATE PARTNERS CHATTANOOGA, LLC - Open Sun, 2 to 4pmNew
 $299,900Active2 beds 2 baths1,254 sq. ft.
523 Callaway Court, Chattanooga, TN 37421
MLS# 1530647Listed by: THE SOURCE REAL ESTATE GROUP - New
 $67,900Active1.3 Acres
6829 Big Ridge Road, Hixson, TN 37343
MLS# 1530649Listed by: KELLER WILLIAMS REALTY - Open Fri, 2 to 6pmNew
 $424,900Active3 beds 3 baths1,545 sq. ft.
3620 Abram Street, Chattanooga, TN 37410
MLS# 1530651Listed by: ROGUE REAL ESTATE COMPANY LLC - Open Sun, 2 to 6pmNew
 $424,900Active3 beds 3 baths1,545 sq. ft.
5188 Certain Circle, Hixson, TN 37343
MLS# 1530653Listed by: ROGUE REAL ESTATE COMPANY LLC - New
 $364,900Active3 beds 3 baths1,557 sq. ft.
1019 Fortitude Trail, Chattanooga, TN 37421
MLS# 3152862Listed by: PARKSIDE REALTY, LLC - New
 $1,200,000Active-- beds -- baths6,086 sq. ft.
11219 Dayton Pike, Soddy Daisy, TN 37379
MLS# 3153020Listed by: BERKSHIRE HATHAWAY HOMESERVICES J DOUGLAS PROP.  $244,900Pending3 beds 2 baths1,232 sq. ft.
8228 Pine Ridge Road, Ooltewah, TN 37363
MLS# 3153025Listed by: GREATER CHATTANOOGA REALTY, KELLER WILLIAMS REALTY- New
 $900,000Active-- beds -- baths4,200 sq. ft.
11215 Dayton Pike, Soddy Daisy, TN 37379
MLS# 3152994Listed by: BERKSHIRE HATHAWAY HOMESERVICES J DOUGLAS PROP.  $407,000Pending2 beds 3 baths1,704 sq. ft.
3356 Stone Creek Drive, Chattanooga, TN 37405
MLS# 20261382Listed by: REAL ESTATE PARTNERS CHATT (MAIN ST)- Open Sun, 2 to 4pm
 $434,900Active3 beds 2 baths1,868 sq. ft.
2435 Chimney Lake Circle, Soddy Daisy, TN 37379
MLS# 1530194Listed by: CRYE-LEIKE, REALTORS  $345,000Pending2 beds 2 baths1,197 sq. ft.
1390 Hixson Pike, Chattanooga, TN 37405
MLS# 1530633Listed by: ZACH TAYLOR - CHATTANOOGA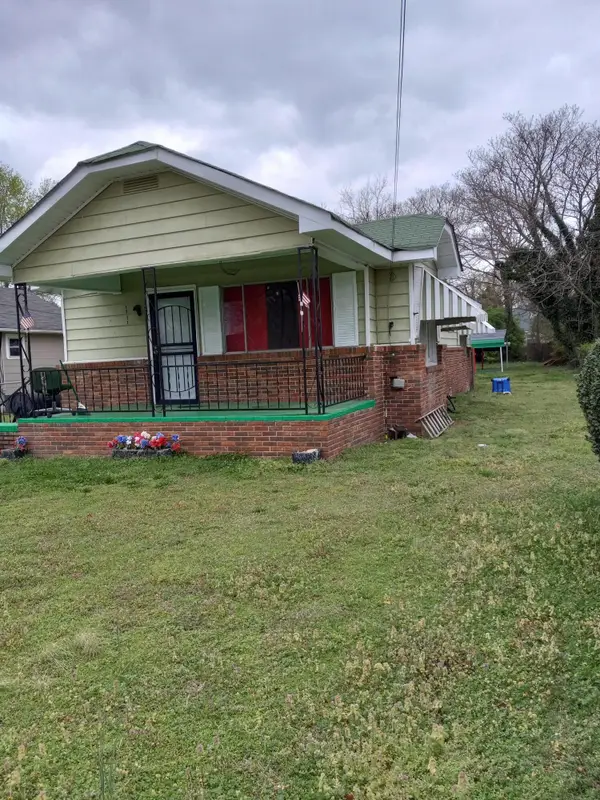 $110,500Pending3 beds 1 baths1,204 sq. ft.
1711 Wilson Street, Chattanooga, TN 37406
MLS# 1530626Listed by: CHATTANOOGA REAL ESTATE CO- New
 $645,000Active3 beds 4 baths2,150 sq. ft.
3117 Greenwich Avenue, Chattanooga, TN 37415
MLS# 1530628Listed by: CRYE-LEIKE, REALTORS - New
 $402,790Active3 beds 3 baths2,160 sq. ft.
8452 Mulberry Way, Ooltewah, TN 37363
MLS# 1530635Listed by: DHI INC - New
 $115,000Active3.17 Acres
8911 Terrace Falls Drive #106, Soddy Daisy, TN 37379
MLS# 1530640Listed by: PREMIER PROPERTY GROUP INC. - New
 $599,900Active3 beds 2 baths2,000 sq. ft.
7873 Honeycomb Lane, Chattanooga, TN 37421
MLS# 1530642Listed by: GREENTECH HOMES LLC - New
 $567,900Active4 beds 4 baths2,200 sq. ft.
8017 Honeycomb Lane, Chattanooga, TN 37421
MLS# 1530780Listed by: GREENTECH HOMES LLC - New
 $600,000Active-- beds -- baths2,800 sq. ft.
11213 Dayton Pike, Soddy Daisy, TN 37379
MLS# 3152922Listed by: BERKSHIRE HATHAWAY HOMESERVICES J DOUGLAS PROP.  $2,409,000Pending438 Acres
Hotwater Rd, Soddy-Daisy, TN 37379
MLS# 1333185Listed by: AFM REAL ESTATE- New
 $1,435,420Active205.06 Acres
Sluder Lane, Soddy-Daisy, TN 37379
MLS# 1333190Listed by: AFM REAL ESTATE - New
 $300,000Active-- beds -- baths1,400 sq. ft.
11209 Dayton Pike, Soddy Daisy, TN 37379
MLS# 3152861Listed by: BERKSHIRE HATHAWAY HOMESERVICES J DOUGLAS PROP.  $409,900Active3 beds 3 baths2,237 sq. ft.
11052 Valmont Way, Collegedale, TN 37302
MLS# 1526821Listed by: SDH CHATTANOOGA LLC- New
 $449,900Active4 beds 3 baths3,005 sq. ft.
11041 Valmont Way, Collegedale, TN 37302
MLS# 1530471Listed by: SDH CHATTANOOGA LLC  $704,240Pending4 beds 4 baths2,800 sq. ft.
1063 Cityscape View #39, Chattanooga, TN 37405
MLS# 1530619Listed by: GREENTECH HOMES LLC- New
 $330,000Active3 beds 2 baths1,657 sq. ft.
6621 Gary Lane, Chattanooga, TN 37421
MLS# 1530618Listed by: REAL ESTATE PARTNERS CHATTANOOGA LLC  $419,900Active4 beds 3 baths2,565 sq. ft.
11053 Valmont Way, Collegedale, TN 37302
MLS# 1526219Listed by: SDH CHATTANOOGA LLC $389,900Active3 beds 2 baths1,770 sq. ft.
11049 Valmont Way, Collegedale, TN 37302
MLS# 1526437Listed by: SDH CHATTANOOGA LLC $800,000Pending22 Acres
4426 Edelweiss Street, Chattanooga, TN 37409
MLS# 1530543Listed by: REAL ESTATE PARTNERS CHATTANOOGA LLC- New
 $349,900Active2 beds 2 baths1,200 sq. ft.
1709 E 13th Street, Chattanooga, TN 37404
MLS# 1529176Listed by: BERKSHIRE HATHAWAY HOMESERVICES J DOUGLAS PROPERTIES  $25,000Pending0.13 Acres
Lot 10 E 46th St. Walthall Street, Chattanooga, TN 37407
MLS# 1530613Listed by: KELLER WILLIAMS REALTY $25,000Pending0.13 Acres
Lot 9 E 46th St. Walthall Street, Chattanooga, TN 37407
MLS# 1530614Listed by: KELLER WILLIAMS REALTY $299,900Pending3 beds 2 baths1,300 sq. ft.
403 Haney Drive, Chattanooga, TN 37411
MLS# 1530615Listed by: THE GROUP REAL ESTATE BROKERAGE- New
 $285,000Active4 beds 2 baths1,728 sq. ft.
1603 Castleberry Avenue, Chattanooga, TN 37412
MLS# 3148463Listed by: ZACH TAYLOR CHATTANOOGA - New
 $499,999Active3 beds 3 baths2,390 sq. ft.
220 Progress Drive, Signal Mountain, TN 37377
MLS# 3152685Listed by: GREATER DOWNTOWN REALTY DBA KELLER WILLIAMS REALTY
Local realty services provided by:CENTURY 21 BELLORA, CENTURY 21 Premier, CENTURY 21 Legacy
Popular searches near Hamilton County, TN
Popular neighborhoods near Hamilton County, TN
- Bakewell, Sale Creek homes for sale
- Birchwood, Birchwood homes for sale
- Bonny Oaks, Chattanooga homes for sale
- Dallas Bay, Soddy Daisy homes for sale
- Dupont, Chattanooga homes for sale
- Eagle Bluff, Chattanooga homes for sale
- Falling Water, Hixson homes for sale
- Harrison, Chattanooga homes for sale
- Harrison Bay, Harrison homes for sale
- Hidden Harbor, Hixson homes for sale
- Hixson, Hixson homes for sale
- Lupton City, Chattanooga homes for sale
- Middle Valley, Hixson homes for sale
- Mont Lake, Soddy Daisy homes for sale
- Murray Hills, Chattanooga homes for sale
- Northgate, Hixson homes for sale
- Ooltewah, Ooltewah homes for sale
- Soddy-Daisy, Soddy Daisy homes for sale
- Walden, Soddy Daisy homes for sale
- Washington Hills, Chattanooga homes for sale
Zip codes near Hamilton County, TN
- 37308 homes for sale
- 37311 homes for sale
- 37312 homes for sale
- 37336 homes for sale
- 37338 homes for sale
- 37341 homes for sale
- 37343 homes for sale
- 37353 homes for sale
- 37363 homes for sale
- 37373 homes for sale
- 37377 homes for sale
- 37379 homes for sale
- 37402 homes for sale
- 37403 homes for sale
- 37404 homes for sale
- 37406 homes for sale
- 37411 homes for sale
- 37415 homes for sale
- 37416 homes for sale
- 37421 homes for sale
Protect your home and budget from life's surprises with an Assurant Home Warranty, backed by a partner that supports you through every step of homeownership. Explore Plans.
©2026 Century 21 Real Estate LLC. All rights reserved. CENTURY 21®, the CENTURY 21 Logo and C21® are service marks owned by Century 21 Real Estate LLC. Century 21 Real Estate LLC fully supports the principles of the Fair Housing Act and the Equal Opportunity Act. Each office is independently owned and operated. Listing information is deemed reliable but not guaranteed accurate.