- Almaden Valley, San Jose homes for sale
- Aptos Beach, Aptos homes for sale
- Aptos Seascape, Aptos homes for sale
- Banana Belt, Santa Cruz homes for sale
- Deer Park Villas, Aptos homes for sale
- Downtown Santa Cruz, Santa Cruz homes for sale
- Lower Ocean, Santa Cruz homes for sale
- Lower Seabright, Santa Cruz homes for sale
- Nobel, Santa Cruz homes for sale
- Pasatiempo, Santa Cruz homes for sale
- River Street District, Santa Cruz homes for sale
- Seabright, Santa Cruz homes for sale
- Seabright Park, Santa Cruz homes for sale
- Seacliff Park, Aptos homes for sale
- Seascape Golf Club, Aptos homes for sale
- Southeastern, Santa Cruz homes for sale
- The Circles, Santa Cruz homes for sale
- Upper Seabright, Santa Cruz homes for sale
- Westlake, Santa Cruz homes for sale
- Westside Industrial District, Santa Cruz homes for sale
Capitola, CA - homes for sale
68 of 68 results displayed
- New
 $359,000Active2 beds 1 baths858 sq. ft.
930 Rosedale Avenue, Capitola, CA 95010
MLS# ML82038003Listed by: CENTURY 21 MASTERS - Open Sat, 1 to 4pmNew
 $1,695,000Active3 beds 2 baths1,472 sq. ft.
105 Wesley Street, Capitola, CA 95010
MLS# ML82039793Listed by: CHRISTIE'S INTERNATIONAL REAL ESTATE SERENO - New
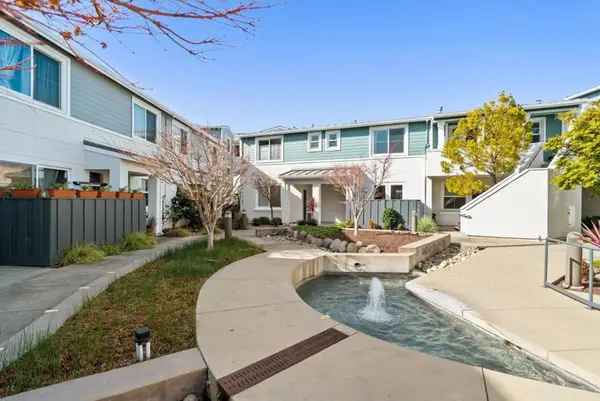
 $630,000Active2 beds 2 baths990 sq. ft.
1925 46th Avenue #127, Capitola, CA 95010
MLS# ML82026574Listed by: ROOM REAL ESTATE - New
 $599,000Active2 beds 1 baths874 sq. ft.
1925 46th Avenue #148, Capitola, CA 95010
MLS# ML82037879Listed by: CHRISTIE'S INTERNATIONAL REAL ESTATE SERENO - Open Sat, 1 to 4pmNew
 $1,550,000Active2 beds 2 baths854 sq. ft.
327 Riverview Avenue #C, Capitola, CA 95010
MLS# ML82039094Listed by: COMPASS - New
 $1,650,000Active3 beds 3 baths1,832 sq. ft.
4750 Capitola Road, Capitola, CA 95010
MLS# ML82039144Listed by: ROOM REAL ESTATE - Open Sat, 12 to 2pmNew
 $685,000Active2 beds 1 baths890 sq. ft.
4475 Diamond Street #3, Capitola, CA 95010
MLS# ML82039108Listed by: DAVID LYNG REAL ESTATE - Open Sat, 1 to 4pmNew
 $1,925,000Active4 beds 2 baths1,861 sq. ft.
213 Cortez Street, Capitola, CA 95010
MLS# ML82038936Listed by: CHRISTIE'S INTERNATIONAL REAL ESTATE SERENO - Open Sat, 2 to 5pmNew
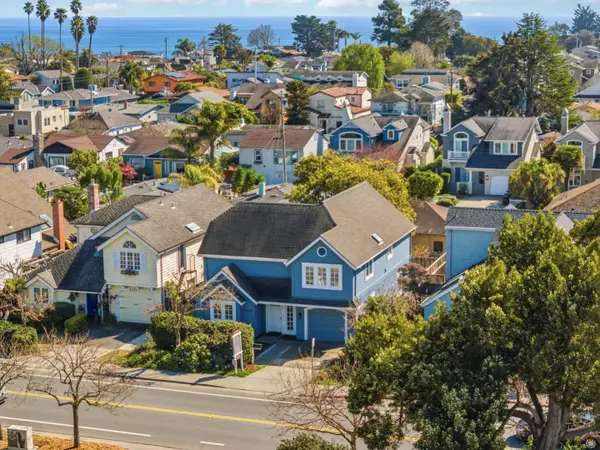
 $1,650,000Active4 beds -- baths2,312 sq. ft.
1576 Heritage Lane, Santa Cruz, CA 95062
MLS# ML82038922Listed by: COMPASS  $3,199,000Active5 beds 3 baths1,926 sq. ft.
1500 Wharf Road #12, Capitola, CA 95010
MLS# ML82038551Listed by: ALLEN PROPERTY GROUP, INC. $3,199,000Active-- beds -- baths1,926 sq. ft.
1500 Wharf Road, Capitola, CA 95010
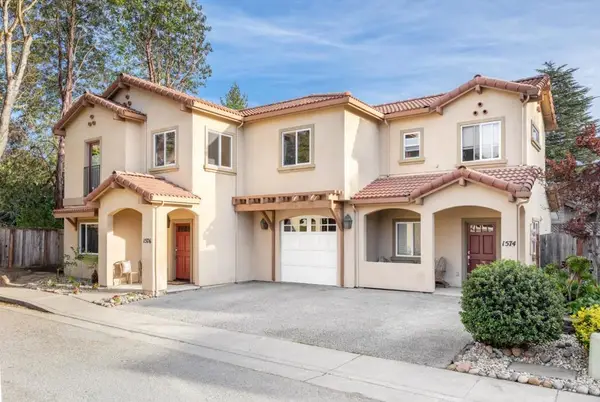
MLS# ML82038556Listed by: ALLEN PROPERTY GROUP, INC. $1,625,000Pending3 beds 3 baths1,690 sq. ft.
2130 Francesco Circle, Capitola, CA 95010
MLS# ML82037871Listed by: SOTHEBY'S INTERNATIONAL REALTY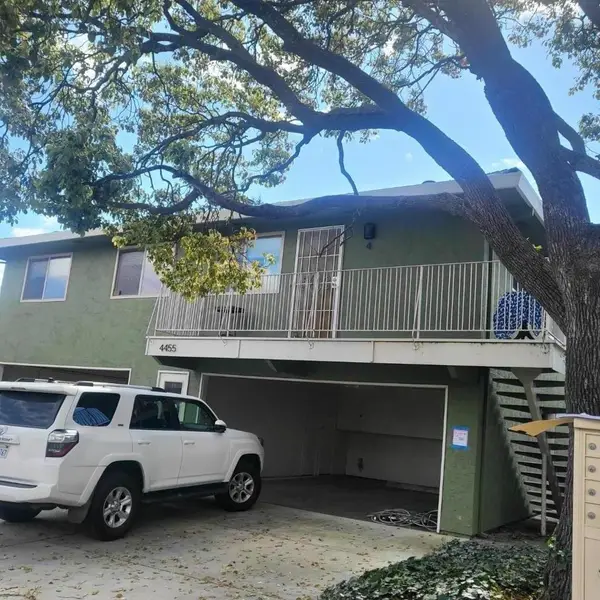 $649,000Active2 beds 1 baths925 sq. ft.
4455 Jade Street #4, Capitola, CA 95010
MLS# ML82037478Listed by: BAILEY PROPERTIES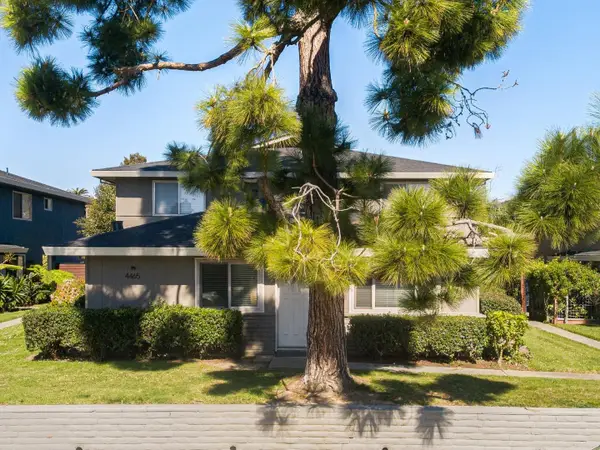 $619,000Pending2 beds 1 baths925 sq. ft.
4465 Diamond Street #4, Capitola, CA 95010
MLS# ML82037192Listed by: DAVID LYNG REAL ESTATE $610,000Active2 beds 2 baths990 sq. ft.
1925 46th Avenue #169, Capitola, CA 95010
MLS# ML82036456Listed by: COLDWELL BANKER REALTY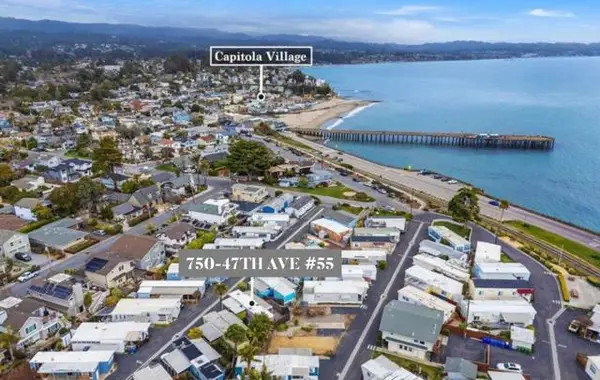 $25,900Pending2 beds 1 baths480 sq. ft.
750 47th Avenue #55, Capitola, CA 95010
MLS# ML82036148Listed by: COMPASS $25,900Active2 beds 1 baths480 sq. ft.
750 47th Avenue, Capitola, CA 95010
MLS# ML82036148Listed by: COMPASS- Open Sat, 2 to 4pm
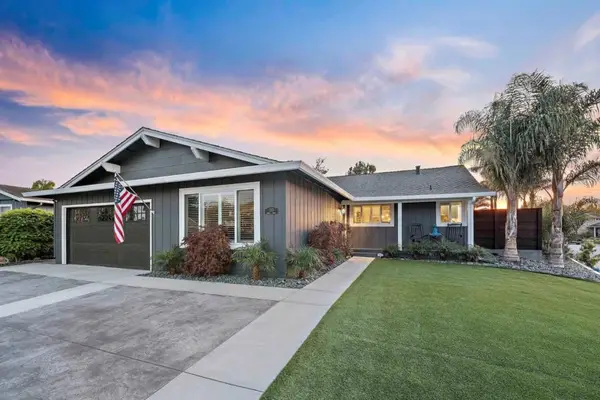
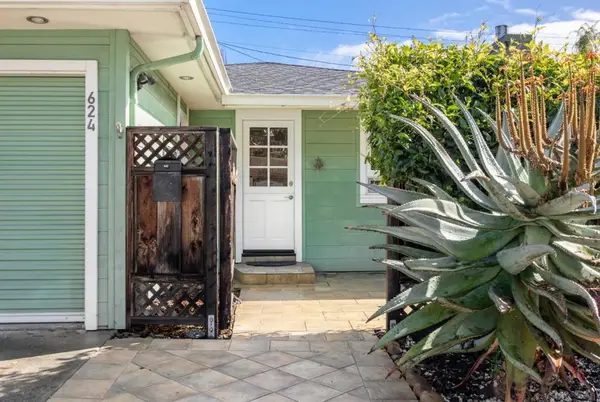 $1,349,000Active2 beds 1 baths950 sq. ft.
624 Riverview Drive, Capitola, CA 95010
MLS# ML82035792Listed by: CHRISTIE'S INTERNATIONAL REAL ESTATE SERENO  $1,599,000Active-- beds -- baths2,370 sq. ft.
404 Monterey Avenue, Capitola, CA 95010
MLS# ML82035702Listed by: GONZALEZ PROPERTIES $1,799,000Pending3 beds -- baths1,153 sq. ft.
318 Park Avenue, Capitola, CA 95010
MLS# ML82034991Listed by: BAILEY PROPERTIES $1,595,000Active3 beds 1 baths1,220 sq. ft.
1771 44th Avenue, Capitola, CA 95010
MLS# ML82034147Listed by: MORGAN REAL ESTATE $859,000Active3 beds 2 baths1,638 sq. ft.
4160 Jade Street #19, Capitola, CA 95010
MLS# ML82034735Listed by: COMPASS $859,000Active3 beds 2 baths1,638 sq. ft.
4160 Jade Street, Capitola, CA 95010
MLS# ML82034735Listed by: COMPASS $755,000Active2 beds 2 baths1,344 sq. ft.
4160 Jade Street #103, Capitola, CA 95010
MLS# ML82033835Listed by: COMPASS $755,000Active2 beds 2 baths1,344 sq. ft.
4160 Jade Street, Capitola, CA 95010
MLS# ML82033835Listed by: COMPASS- Open Sat, 12 to 3pm
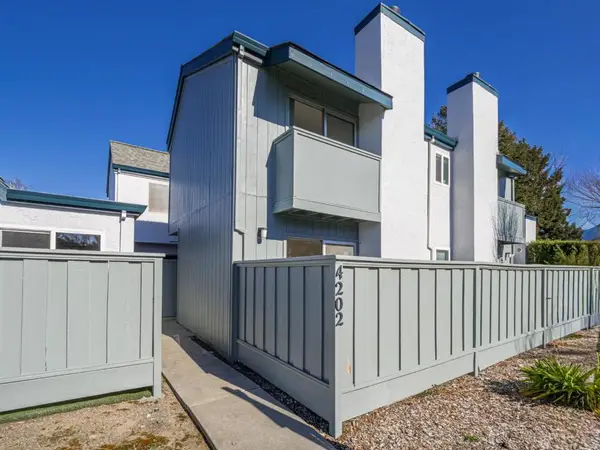 $919,000Active3 beds 3 baths1,422 sq. ft.
4202 Sea Pines Court, Capitola, CA 95010
MLS# ML82033614Listed by: BAILEY PROPERTIES 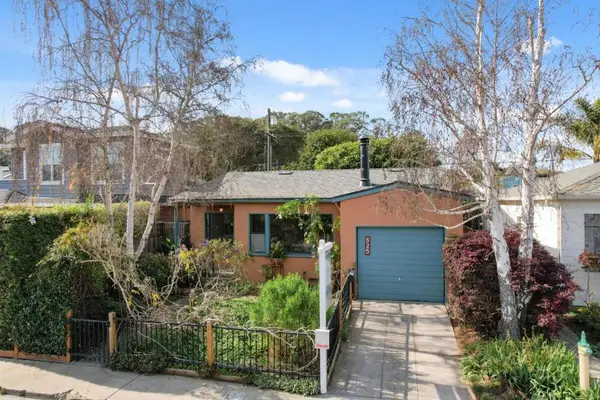 $1,298,000Pending2 beds 1 baths926 sq. ft.
625 Gilroy Drive, Capitola, CA 95010
MLS# ML82033694Listed by: ROOM REAL ESTATE- Open Sun, 1 to 4pm
 $1,025,000Active2 beds 3 baths1,006 sq. ft.
1066 41st Avenue #D106, Capitola, CA 95010
MLS# ML82029149Listed by: DAVID LYNG REAL ESTATE  $899,000Active0.25 Acres
0 Roland, Santa Cruz, CA 95062
MLS# ML82033226Listed by: LIVE LOVE SANTA CRUZ $1,550,000Active3 beds 2 baths1,549 sq. ft.
1009 Sir Francis Avenue, Capitola, CA 95010
MLS# ML82033158Listed by: DAVID LYNG REAL ESTATE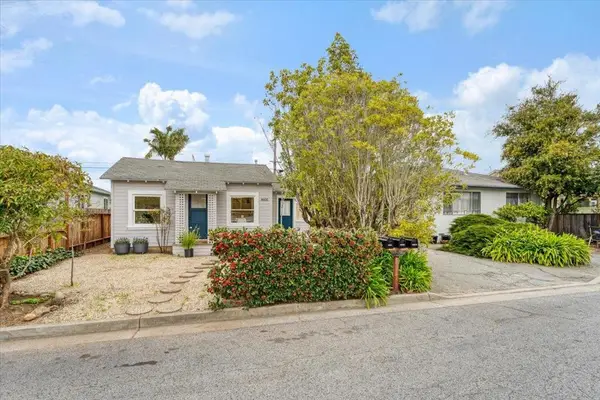 $1,499,000Pending-- beds -- baths1,887 sq. ft.
4605 Opal Street, Capitola, CA 95010
MLS# ML82032740Listed by: COMPASS $695,000Active1 beds 1 baths595 sq. ft.
1066 41st Avenue #A303, Capitola, CA 95010
MLS# ML82032817Listed by: AMBER GREWER REAL ESTATE $589,000Active2 beds 1 baths893 sq. ft.
922 Ponselle Lane #3, Capitola, CA 95010
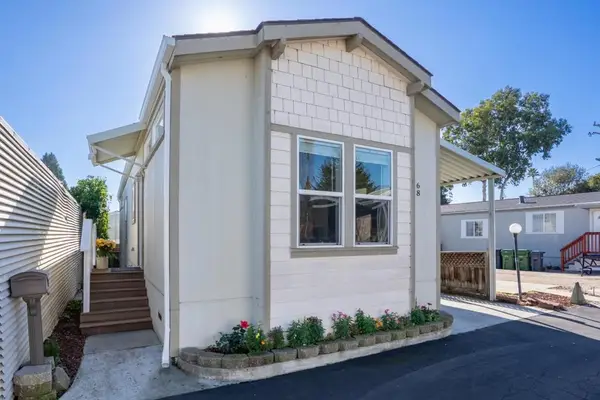
MLS# ML82032675Listed by: CENTURY 21 MASTERS $369,000Active2 beds 2 baths980 sq. ft.
930 Rosedale Avenue #64, Capitola, CA 95010
MLS# ML82030002Listed by: EXP REALTY OF CALIFORNIA INC $369,000Active2 beds 2 baths980 sq. ft.
930 Rosedale Avenue, Capitola, CA 95010
MLS# ML82030002Listed by: EXP REALTY OF CALIFORNIA INC $399,950Active2 beds 1 baths845 sq. ft.
1099 38th Avenue, Santa Cruz, CA 95062
MLS# ML82032459Listed by: FRANCIS MURPHY,REALTOR $399,950Active2 beds 1 baths845 sq. ft.
1099 38th Avenue #49, Santa Cruz, CA 95062
MLS# ML82032459Listed by: FRANK MURPHY REALTY $689,000Active2 beds 1 baths800 sq. ft.
1420 Ruby Court #1, Capitola, CA 95010
MLS# ML82032264Listed by: BAILEY PROPERTIES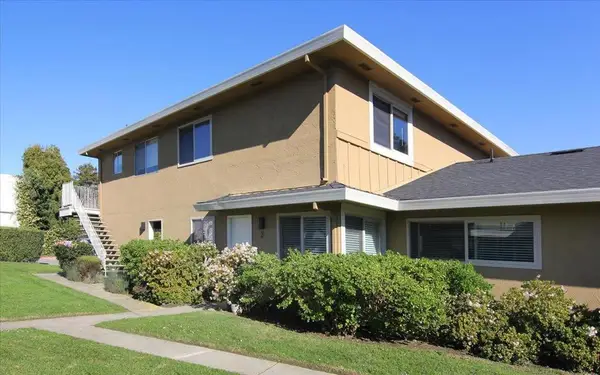 $599,000Active2 beds 1 baths890 sq. ft.
4435 Diamond Street #2, Capitola, CA 95010
MLS# ML82031518Listed by: REAL ESTATE EIGHT THREE ONE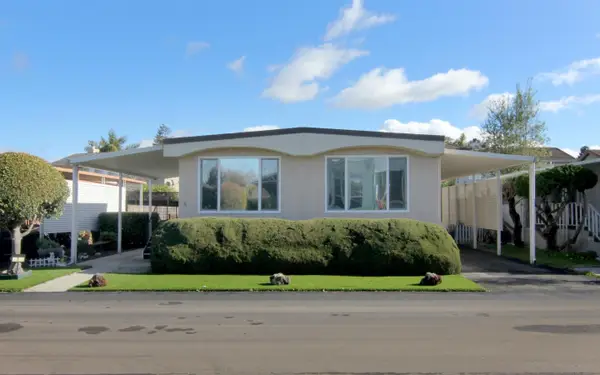 $299,000Pending2 beds 2 baths1,368 sq. ft.
4425 Clares Street #3, Capitola, CA 95010
MLS# ML82030810Listed by: SHERMAN & BOONE REALTORS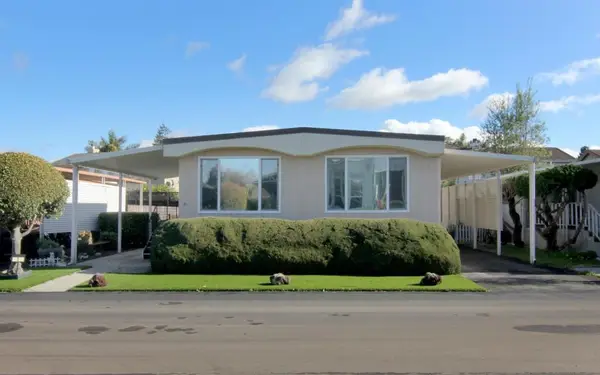 $299,000Active2 beds 2 baths1,368 sq. ft.
4425 Clares Street, Capitola, CA 95010
MLS# ML82030810Listed by: SHERMAN & BOONE REALTORS $999,000Active2 beds 3 baths1,544 sq. ft.
4212 Gull Cove Way, Capitola, CA 95010
MLS# ML82028413Listed by: COLDWELL BANKER REALTY $649,000Active1 beds 1 baths595 sq. ft.
1066 41st Avenue #A207, Capitola, CA 95010
MLS# ML82030343Listed by: COMPASS $739,000Active2 beds 2 baths1,194 sq. ft.
4160 Jade Street, Capitola, CA 95010
MLS# ML82029035Listed by: COMPASS $10,800,000Active14 beds 12 baths7,932 sq. ft.
620 El Salto Drive, Capitola, CA 95010
MLS# 325092474Listed by: KELLER WILLIAMS BEVERLY HILLS $1,695,000Pending2 beds 1 baths1,031 sq. ft.
604 Oak Drive, Capitola, CA 95010
MLS# ML82037033Listed by: COLDWELL BANKER REALTY $775,000Active2 beds 2 baths1,440 sq. ft.
300 Plum Street, Capitola, CA 95010
MLS# ML82024760Listed by: BAILEY PROPERTIES $775,000Active2 beds 2 baths1,440 sq. ft.
300 Plum Street #23, Capitola, CA 95010
MLS# ML82024760Listed by: BAILEY PROPERTIES $2,650,000Active3 beds 6 baths3,542 sq. ft.
208 Capitola Avenue, Capitola, CA 95010
MLS# ML82022907Listed by: DAVID LYNG REAL ESTATE- Open Sat, 1 to 4pm
 $509,000Active1 beds 1 baths665 sq. ft.
1925 46th Avenue #71, Capitola, CA 95010
MLS# ML82021564Listed by: BAILEY PROPERTIES  $1,549,000Pending4 beds 3 baths2,000 sq. ft.
522 Oak Drive, Capitola, CA 95010
MLS# ML82016367Listed by: COMPASS $279,000Active2 beds 2 baths1,244 sq. ft.
4425 Clares Street, Capitola, CA 95010
MLS# ML82013713Listed by: EXP REALTY OF CALIFORNIA INC $279,000Pending2 beds 2 baths1,244 sq. ft.
4425 Clares Street #52, Capitola, CA 95010
MLS# ML82013713Listed by: EXP REALTY OF CALIFORNIA INC $739,000Active2 beds 2 baths1,194 sq. ft.
4160 Jade Street #90, Capitola, CA 95010
MLS# ML82029035Listed by: COMPASS $150,000Active2 beds 2 baths800 sq. ft.
750 47th Avenue, Capitola, CA 95010
MLS# ML82003068Listed by: COLDWELL BANKER REALTY $150,000Active2 beds 2 baths800 sq. ft.
750 47th Avenue #69, Capitola, CA 95010
MLS# ML82003068Listed by: COLDWELL BANKER REALTY $99,900Active1 beds 1 baths470 sq. ft.
750 47th Avenue, Capitola, CA 95010
MLS# ML82005855Listed by: COMPASS $99,900Active1 beds 1 baths470 sq. ft.
750 47th Avenue #56, Capitola, CA 95010
MLS# ML82005855Listed by: COMPASS $374,900Active2 beds 2 baths1,080 sq. ft.
2155 Wharf Road, Capitola, CA 95010
MLS# ML82023640Listed by: CENTURY 21 MASTERS $374,900Active2 beds 2 baths1,080 sq. ft.
2155 Wharf Road #12, Capitola, CA 95010
MLS# ML82023640Listed by: CENTURY 21 MASTERS $1,400,000Active-- beds -- baths854 sq. ft.
4980 Capitola Road, Capitola, CA 95010
MLS# ML81975682Listed by: CHRISTIE'S INTERNATIONAL REAL ESTATE SERENO $7,425,000Active4 beds 5 baths3,302 sq. ft.
108 Grove Lane, Capitola, CA 95010
MLS# ML81945898Listed by: CHRISTIE'S INTERNATIONAL REAL ESTATE SERENO $1,700,000Pending0.09 Acres
206 Hollister Avenue, Capitola, CA 95010
MLS# ML81905809Listed by: MONTEREY BAY PROPERTIES $674,000Pending3 beds 3 baths1,665 sq. ft.
Address Withheld By Seller, Capitola, CA 95010
MLS# ML81439468Listed by: EQUITY MORTGAGE & INVESTMENTS $550,000Pending2 beds 1 baths672 sq. ft.
Address Withheld By Seller, Capitola, CA 95010
MLS# ML81453748Listed by: SANTA CLARA REALTY $1,799,900Pending-- beds -- baths1,467 sq. ft.
709 El Salto Drive, Capitola, CA 95010
MLS# ML81882024Listed by: COLDWELL BANKER REALTY $1,395,000Active4 beds 2 baths1,487 sq. ft.
Address Withheld By Seller, Capitola, CA 95010
MLS# ML81892501Listed by: COWLEY PROPERTIES $549,000Pending3 beds 2 baths1,080 sq. ft.
Address Withheld By Seller, Capitola, CA 95010
MLS# ML81893916Listed by: DAVID LYNG REAL ESTATE
Local realty services provided by:CENTURY 21 LOTUS, CENTURY 21 Sierra Properties, CENTURY 21 Epic
The information being provided by California Regional MLS (Southern California) is for the consumer's personal, non-commercial use and may not be used for any purpose other than to identify prospective properties consumer may be interested in purchasing. Any information relating to real estate for sale referenced on this web site comes from the Internet Data Exchange (IDX) program of the California Regional MLS (Southern California). CENTURY 21 LOTUS is not a Multiple Listing Service (MLS), nor does it offer MLS access. This website is a service of CENTURY 21 LOTUS, a broker participant of California Regional MLS (Southern California). This web site may reference real estate listing(s) held by a brokerage firm other than the broker and/or agent who owns this web site.
The accuracy of all information, regardless of source, including but not limited to open house information, square footages and lot sizes, is deemed reliable but not guaranteed and should be personally verified through personal inspection by and/or with the appropriate professionals. The data contained herein is copyrighted by California Regional MLS (Southern California) and is protected by all applicable copyright laws. Any unauthorized dissemination of this information is in violation of copyright laws and is strictly prohibited.
Copyright 2021 California Regional MLS (Southern California). All rights reserved.
The information being provided by Bay Area Real Estate Information Service is for the consumer's personal, non-commercial use and may not be used for any purpose other than to identify prospective properties consumer may be interested in purchasing. Any information relating to real estate for sale referenced on this web site comes from the Internet Data Exchange (IDX) program of the Bay Area Real Estate Information Service. CENTURY 21 Epic is not a Multiple Listing Service (MLS), nor does it offer MLS access. This website is a service of CENTURY 21 Epic, a broker participant of Bay Area Real Estate Information Service. This web site may reference real estate listing(s) held by a brokerage firm other than the broker and/or agent who owns this web site.
The accuracy of all information, regardless of source, including but not limited to open house information, square footages and lot sizes, is deemed reliable but not guaranteed and should be personally verified through personal inspection by and/or with the appropriate professionals. The data contained herein is copyrighted by Bay Area Real Estate Information Service and is protected by all applicable copyright laws. Any unauthorized dissemination of this information is in violation of copyright laws and is strictly prohibited.
Properties in listings may have been sold or may no longer be available.
Copyright 2026 Bay Area Real Estate Information Service. All rights reserved.
Neighborhoods near Capitola, CA
Zip codes near Capitola, CA
- 95003 homes for sale
- 95005 homes for sale
- 95006 homes for sale
- 95007 homes for sale
- 95010 homes for sale
- 95012 homes for sale
- 95017 homes for sale
- 95018 homes for sale
- 95019 homes for sale
- 95030 homes for sale
- 95032 homes for sale
- 95033 homes for sale
- 95039 homes for sale
- 95060 homes for sale
- 95062 homes for sale
- 95065 homes for sale
- 95066 homes for sale
- 95073 homes for sale
- 95076 homes for sale
- 95120 homes for sale
Popular searches near Capitola, CA
- Amesti homes for sale
- Aptos homes for sale
- Aptos Hills-Larkin Valley homes for sale
- Ben Lomond homes for sale
- Corralitos homes for sale
- Day Valley homes for sale
- Felton homes for sale
- Freedom homes for sale
- La Selva Beach homes for sale
- Live Oak homes for sale
- Mt Hermon homes for sale
- Pasatiempo homes for sale
- Pleasure Point homes for sale
- Rio Del Mar homes for sale
- Santa Cruz homes for sale
- Scotts Valley homes for sale
- Seacliff homes for sale
- Soquel homes for sale
- Summit Rd homes for sale
- Twin Lakes homes for sale
Protect your home and budget from life's surprises with an Assurant Home Warranty, backed by a partner that supports you through every step of homeownership. Explore Plans.
©2026 Century 21 Real Estate LLC. All rights reserved. CENTURY 21®, the CENTURY 21 Logo and C21® are service marks owned by Century 21 Real Estate LLC. Century 21 Real Estate LLC fully supports the principles of the Fair Housing Act and the Equal Opportunity Act. Each office is independently owned and operated. Listing information is deemed reliable but not guaranteed accurate.