- Ash homes for sale
- Bogue homes for sale
- Bolton homes for sale
- Bolton Township homes for sale
- Bug Hill homes for sale
- Chadbourn Township homes for sale
- Chadbourn homes for sale
- Clarendon homes for sale
- Hallsboro homes for sale
- Lake Waccamaw homes for sale
- Lees homes for sale
- Nakina homes for sale
- South Williams homes for sale
- Tabor City homes for sale
- Waccamaw homes for sale
- Waccamaw homes for sale
- Welch Creek homes for sale
- Whiteville township homes for sale
- Whiteville homes for sale
- Williams homes for sale
Columbus County, NC - homes for sale
177 of 177 results displayed
- New
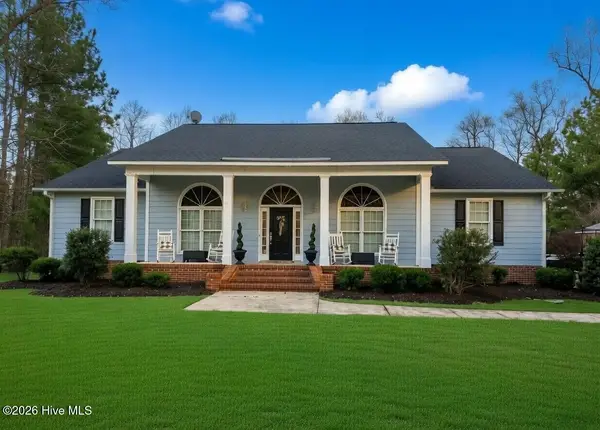 $510,000Active3 beds 3 baths3,410 sq. ft.
251 Whites Crossing Lane, Whiteville, NC 28472
MLS# 100563366Listed by: LPT REALTY - New
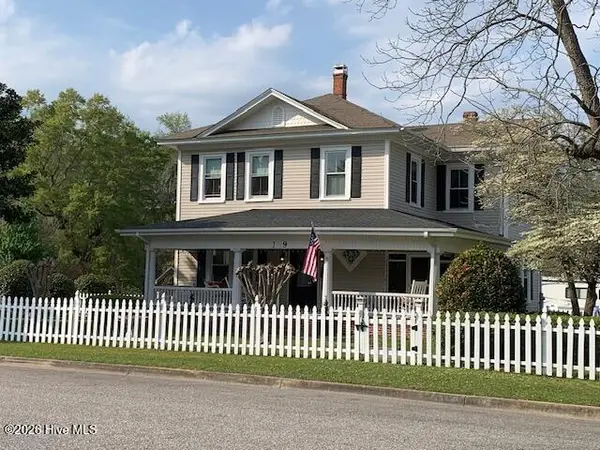 $424,900Active4 beds 2 baths2,800 sq. ft.
129 E Nance Street, Whiteville, NC 28472
MLS# 100563216Listed by: BURROUGHS & COMPANY, LLC - New
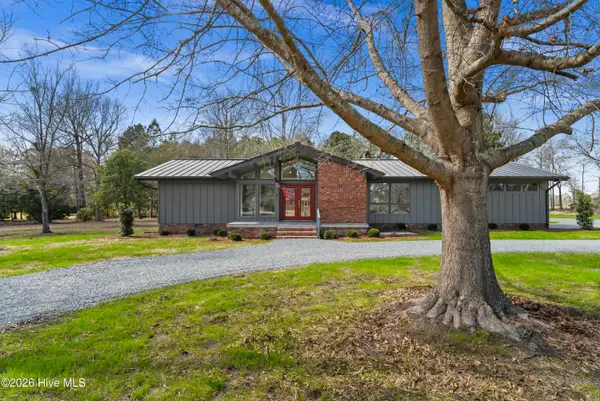
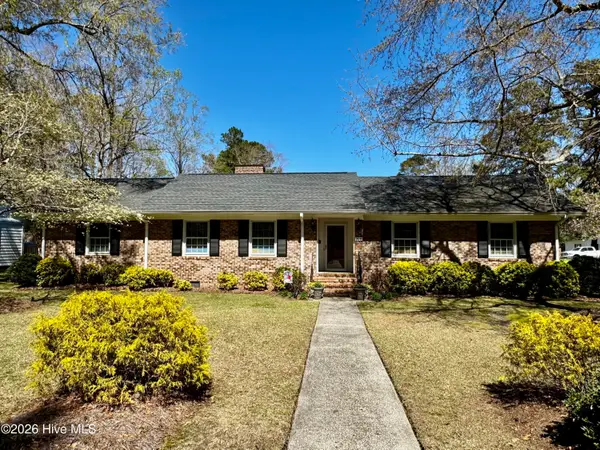 $289,000Active3 beds 2 baths2,109 sq. ft.
200 Elm Street, Whiteville, NC 28472
MLS# 100562986Listed by: HILTON AUCTION & REALTY INC-WHITEVILLE - New
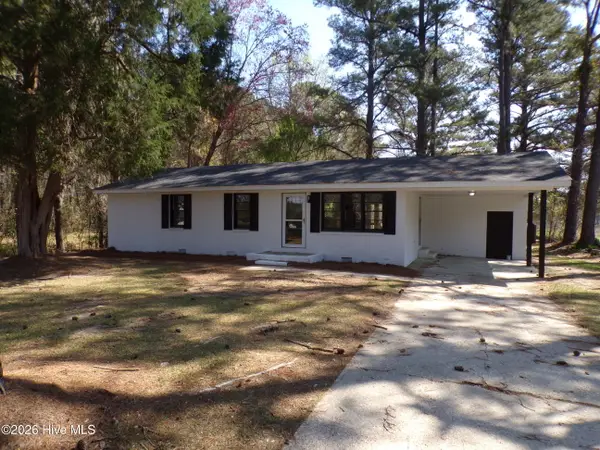 $179,900Active3 beds 1 baths1,124 sq. ft.
1525 Seven Creeks Highway, Whiteville, NC 28472
MLS# 100562942Listed by: CARDOSO & COMPANY - New
 $647,530Active4 beds 3 baths2,332 sq. ft.
122 Live Oak Circle, Lake Waccamaw, NC 28450
MLS# 100562704Listed by: COLDWELL BANKER SEA COAST ADVANTAGE - New
 $130,000Active3 beds 1 baths1,575 sq. ft.
1097 Joe Brown Highway N, Chadbourn, NC 28431
MLS# 4361393Listed by: TOP BROKERAGE LLC - New
 $229,900Active3 beds 1 baths1,423 sq. ft.
221 N Thompson Street, Whiteville, NC 28472
MLS# 100562415Listed by: COLDWELL BANKER SEA COAST ADVANTAGE - New
 $310,000Active3 beds 2 baths1,539 sq. ft.
6195 Red Hill Road, Whiteville, NC 28472
MLS# 100562445Listed by: HILTON AUCTION & REALTY INC-WHITEVILLE  $370,000Pending4 beds 3 baths3,230 sq. ft.
1470 Rico Road, Whiteville, NC 28472
MLS# 100562336Listed by: LPT REALTY- New
 $489,000Active3 beds 2 baths
828 Chair Factory Road, Nakina, NC 28455
MLS# 1213169Listed by: NORTHGROUP REAL ESTATE
- New
 $489,000Active3 beds 2 baths1,273 sq. ft.
828 Chair Factory Road, Whiteville, NC 28472
MLS# 10154578Listed by: NORTHGROUP REAL ESTATE, INC. - New
 $240,000Active3 beds 2 baths1,892 sq. ft.
118 E Wyche Street, Whiteville, NC 28472
MLS# 100561797Listed by: COLDWELL BANKER SEA COAST ADVANTAGE - New
 $899,000Active4 beds 4 baths3,670 sq. ft.
1000 Pine Street, Lake Waccamaw, NC 28450
MLS# 100561739Listed by: COLDWELL BANKER SEA COAST ADVANTAGE 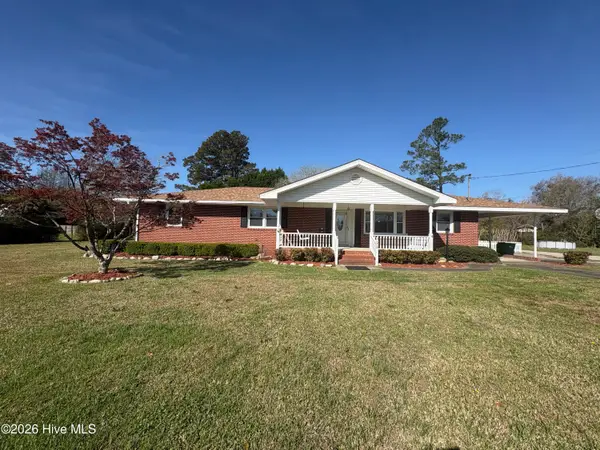 $199,000Pending3 beds 2 baths1,984 sq. ft.
205 Miller Street, Chadbourn, NC 28431
MLS# 100560907Listed by: COLDWELL BANKER SLOANE $430,000Active4 beds 2 baths2,467 sq. ft.
863 Fred Powell Road, Whiteville, NC 28472
MLS# 100560664Listed by: COLDWELL BANKER SLOANE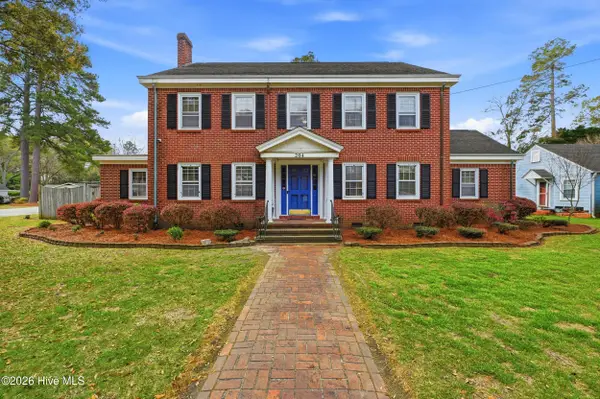 $435,000Active4 beds 3 baths2,998 sq. ft.
204 E College Street, Whiteville, NC 28472
MLS# 100560095Listed by: REAL BROKER LLC $295,000Pending3 beds 2 baths1,880 sq. ft.
6253 Livingston Chapel Road, Delco, NC 28436
MLS# 100559656Listed by: COASTAL PROPERTIES $175,000Pending4 beds 3 baths1,567 sq. ft.
1217 Forest Drive, Whiteville, NC 28472
MLS# 100559129Listed by: COLDWELL BANKER SEA COAST ADVANTAGE-MIDTOWN $309,000Active3 beds 2 baths1,447 sq. ft.
21 Spring Lane, Whiteville, NC 28472
MLS# 100559045Listed by: TURNER REALTY TEAM $417,000Active3 beds 3 baths2,382 sq. ft.
4803 Andrew Jackson Highway Sw, Chadbourn, NC 28431
MLS# 100549344Listed by: ONLY WAY REALTY CAROLINA GRAND STRAND PROPERTIES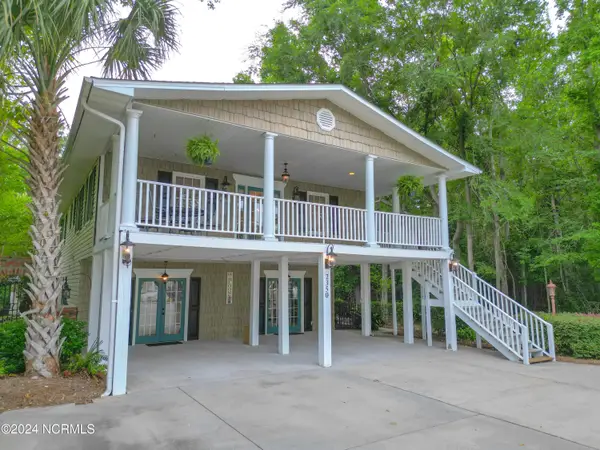 $565,000Active4 beds 3 baths2,760 sq. ft.
2350 Waccamaw Shores Road, Lake Waccamaw, NC 28450
MLS# 100558799Listed by: HILTON AUCTION & REALTY INC-WHITEVILLE $69,900Pending3 beds 2 baths1,602 sq. ft.
332 Best Road, Whiteville, NC 28472
MLS# 4354431Listed by: TOP BROKERAGE LLC $259,900Active3 beds 2 baths1,846 sq. ft.
7613 Princess Ann Road, Evergreen, NC 28438
MLS# 100558642Listed by: ONLY WAY REALTY CAROLINA GRAND STRAND PROPERTIES $130,000Active3 beds 3 baths1,630 sq. ft.
402 E 2nd Avenue, Chadbourn, NC 28431
MLS# 100557721Listed by: EXP REALTY $314,000Active3 beds 3 baths3,330 sq. ft.
2391 Bill Hooks Road, Whiteville, NC 28472
MLS# 100557572Listed by: EXP REALTY $199,900Pending3 beds 2 baths1,297 sq. ft.
625 Blue Jean Road, Whiteville, NC 28472
MLS# 100557378Listed by: EXP REALTY $155,000Active4 beds 3 baths3,400 sq. ft.
4770 S James B White Hwy., Whiteville, NC 28472
MLS# 2605253Listed by: OCEAN BREEZE PROPERTIES, LLC $512,430Active4 beds 3 baths3,187 sq. ft.
104 Waterfall Lane, Whiteville, NC 28472
MLS# 100557173Listed by: COLDWELL BANKER SEA COAST ADVANTAGE $134,900Active2 beds 1 baths924 sq. ft.
205 N Thompson Street, Whiteville, NC 28472
MLS# 100557013Listed by: COLDWELL BANKER SEA COAST ADVANTAGE $247,500Pending2 beds 2 baths1,637 sq. ft.
687 Bitmore Road, Whiteville, NC 28472
MLS# 100556969Listed by: TATUM REALTY LLC $258,000Active3 beds 2 baths1,908 sq. ft.
3689 Wright Road, Tabor City, NC 28463
MLS# 100556959Listed by: KELLER WILLIAMS INNOVATE-OIB MAINLAND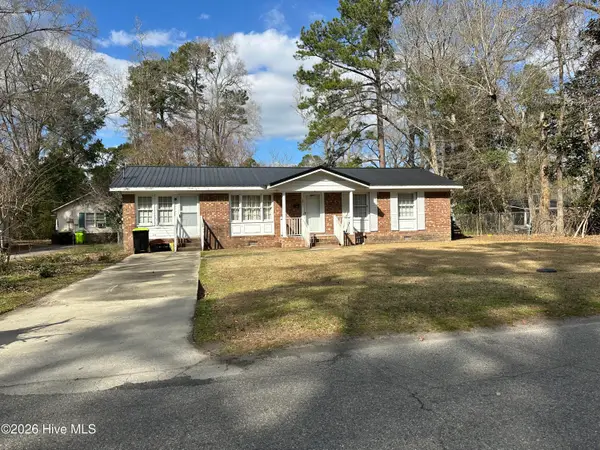 $145,000Active2 beds 1 baths1,456 sq. ft.
221 E Lewis Street, Whiteville, NC 28472
MLS# 100556421Listed by: FIRST CHOICE PRO REALTY
 $155,000Active2 beds 1 baths960 sq. ft.
374 New Life Church Road, Tabor City, NC 28463
MLS# 100556299Listed by: CENTURY 21 THOMAS INCORPORATED DBA THOMAS REAL ESTATE, LLC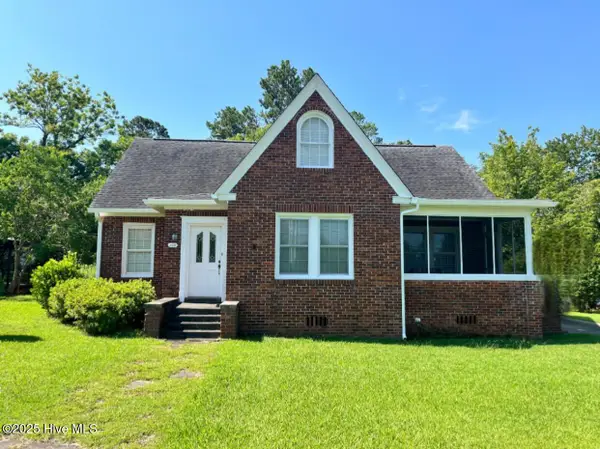 $299,000Active5 beds 2 baths2,373 sq. ft.
109 W Wyche Street, Whiteville, NC 28472
MLS# 100556276Listed by: FIRST CHOICE PRO REALTY $453,730Active4 beds 3 baths2,472 sq. ft.
11222 Peacock Flower Street, Cypress, TX 77433
MLS# 71938321Listed by: HIGHLAND HOMES REALTY $414,930Active3 beds 3 baths1,866 sq. ft.
11226 Peacock Flower Street, Cypress, TX 77433
MLS# 76386311Listed by: HIGHLAND HOMES REALTY $225,000Active4 beds 2 baths1,694 sq. ft.
1349 Hinsons Crossroads, Fair Bluff, NC 28439
MLS# 100556077Listed by: ONLY WAY REALTY CAROLINA GRAND STRAND PROPERTIES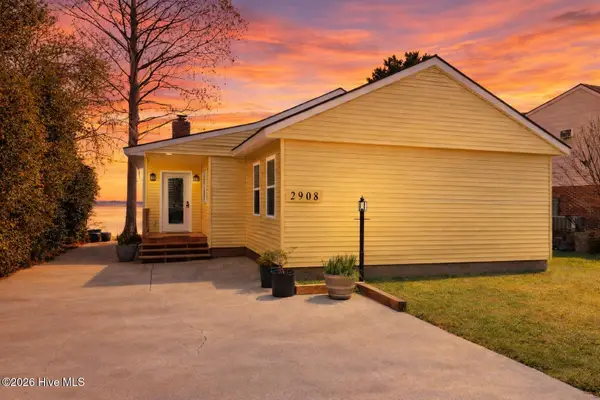 $590,000Active3 beds 2 baths1,320 sq. ft.
2908 Canal Cove Road, Lake Waccamaw, NC 28450
MLS# 100556036Listed by: LIVE OAKS REALTY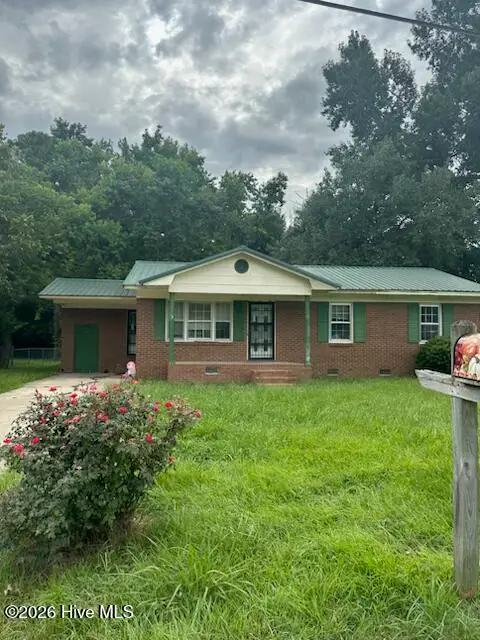 $139,900Pending2 beds 1 baths1,088 sq. ft.
106 S Wilkes Street, Chadbourn, NC 28431
MLS# 100556013Listed by: ONLY WAY REALTY CAROLINA GRAND STRAND PROPERTIES $324,900Active3 beds 2 baths1,530 sq. ft.
305 E Oak Street, Lake Waccamaw, NC 28450
MLS# 100555801Listed by: FATHOM REALTY NC LLC $252,490Active3 beds 2 baths2,179 sq. ft.
63 Ashworth Dr., Tabor City, NC 28463
MLS# 2604531Listed by: DR HORTON $169,900Pending3 beds 2 baths1,004 sq. ft.
2718 Dock Road, Whiteville, NC 28472
MLS# 100555507Listed by: PROACTIVE REAL ESTATE- Open Sat, 12 to 3pm
 $400,000Active3 beds 3 baths1,764 sq. ft.
2001 Old Lumberton Road, Whiteville, NC 28472
MLS# LP757610Listed by: LPT REALTY LLC  $307,000Active3 beds 3 baths1,820 sq. ft.
215 Larilin Drive, Whiteville, NC 28472
MLS# 100555343Listed by: TATUM REALTY LLC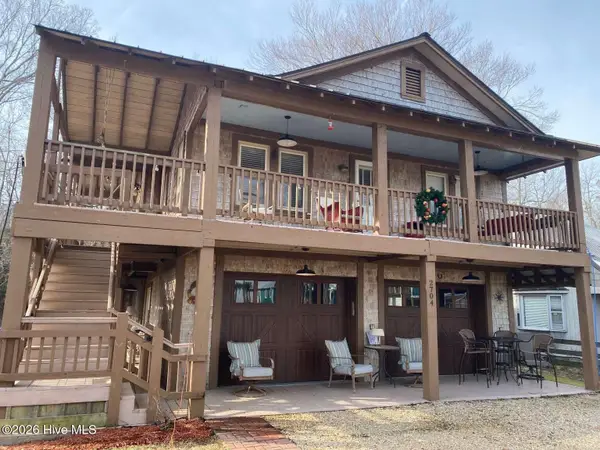 $525,000Active5 beds 3 baths2,344 sq. ft.
2704 Waccamaw Shores Road, Lake Waccamaw, NC 28450
MLS# 100555235Listed by: CHOSEN REALTY OF NC $209,990Active2 beds 2 baths813 sq. ft.
224 Ashworth Drive, Tabor City, NC 28463
MLS# 100555088Listed by: D R HORTON, INC. $216,990Active3 beds 2 baths1,023 sq. ft.
240 Ashworth Drive, Tabor City, NC 28463
MLS# 100555102Listed by: D R HORTON, INC. $439,000Active3 beds 3 baths2,262 sq. ft.
11235 Peacock Flower Street, Cypress, TX 77433
MLS# 27655869Listed by: HIGHLAND HOMES REALTY $344,000Active3 beds 2 baths1,471 sq. ft.
291 Whitehall Road, Whiteville, NC 28472
MLS# 100554876Listed by: J. RAY REALTY, LLC $379,000Active3 beds 2 baths1,466 sq. ft.
4998 Peacock Road, Whiteville, NC 28472
MLS# 100554772Listed by: ONLY WAY REALTY CAROLINA GRAND STRAND PROPERTIES $298,000Active3 beds 2 baths1,820 sq. ft.
114 Church Road, Riegelwood, NC 28456
MLS# 100554743Listed by: COASTAL PROPERTIES $319,900Active3 beds 3 baths2,214 sq. ft.
503 Anderson Street, Tabor City, NC 28463
MLS# 100554569Listed by: ONLY WAY REALTY CAROLINA GRAND STRAND PROPERTIES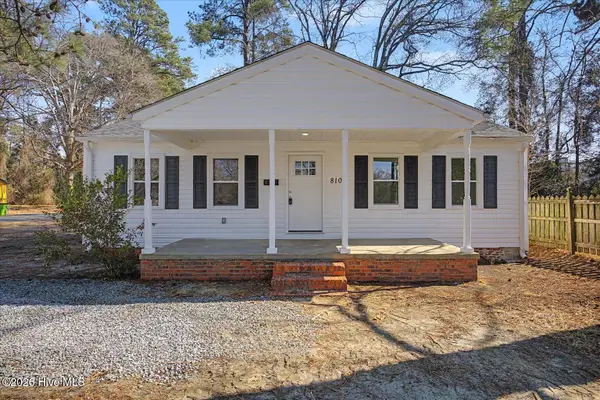 $185,000Pending3 beds 2 baths1,314 sq. ft.
810 N Lee Street, Whiteville, NC 28472
MLS# 100554181Listed by: EXP REALTY $354,900Pending3 beds 2 baths1,603 sq. ft.
403 Justice Flynn Road, Riegelwood, NC 28456
MLS# 100553870Listed by: KELLER WILLIAMS INNOVATE-WILMINGTON $145,000Active2 beds 1 baths789 sq. ft.
100 E Bell St., Tabor City, NC 28463
MLS# 2603533Listed by: BURROUGHS & COMPANY, LLC $254,990Active4 beds 2 baths1,774 sq. ft.
31 Ashworth Drive, Tabor City, NC 28463
MLS# 100552123Listed by: D R HORTON, INC. $212,990Active2 beds 2 baths813 sq. ft.
236 Ashworth Drive, Tabor City, NC 28463
MLS# 100552103Listed by: D R HORTON, INC. $237,990Active3 beds 2 baths1,475 sq. ft.
22 Ashworth Drive #Kerry A- Lot 64, Tabor City, NC 28463
MLS# 100552088Listed by: D R HORTON, INC. $237,990Active3 beds 2 baths1,977 sq. ft.
22 Ashworth Dr., Tabor City, NC 28463
MLS# 2602709Listed by: DR HORTON $1,900,000Active-- beds -- baths4,104 sq. ft.
2770 Bella Coola Road, Lake Waccamaw, NC 28450
MLS# 100552030Listed by: ESTATE LEGACY, LLC $289,900Active3 beds 2 baths1,625 sq. ft.
106 Cornwallis Road, Riegelwood, NC 28456
MLS# 100551926Listed by: NORTHGROUP REAL ESTATE LLC $140,000Pending5 beds 4 baths1,612 sq. ft.
51 Lakeside Drive, Fair Bluff, NC 28439
MLS# 4330551Listed by: MCCLURE GROUP REALTY LLC $399,000Active3 beds 4 baths3,106 sq. ft.
227 E College Street, Whiteville, NC 28472
MLS# 100551545Listed by: NANCE REAL ESTATE $319,000Active3 beds 4 baths2,856 sq. ft.
509 Bentmoor Drive, Whiteville, NC 28472
MLS# 100551549Listed by: J. RAY REALTY, LLC $310,000Pending3 beds 2 baths1,870 sq. ft.
1529 Vinegar Hill Road, Clarendon, NC 28432
MLS# 100551203Listed by: HONEY IN THE ROCK REALTY $205,000Active3 beds 2 baths1,604 sq. ft.
131 Pineway Street Ne, Whiteville, NC 28472
MLS# 100551205Listed by: BERKSHIRE HATHAWAY HOMESERVICES CAROLINA PREMIER PROPERTIES $59,000Pending3 beds 1 baths866 sq. ft.
6194 Joe Brown Highway S, Chadbourn, NC 28431
MLS# 100550652Listed by: GATOR REALTY GROUP $439,900Pending4 beds 5 baths2,970 sq. ft.
395 Hemlock Drive, Whiteville, NC 28472
MLS# 100550668Listed by: THE FIRM NC $363,200Active3 beds 2 baths2,104 sq. ft.
83 Barrow Drive, Whiteville, NC 28472
MLS# 100550519Listed by: LPT REALTY $369,900Active3 beds 2 baths1,897 sq. ft.
6370 Honey Hill Road, Hallsboro, NC 28442
MLS# 100550429Listed by: TATUM REALTY LLC $187,500Active3 beds 1 baths1,680 sq. ft.
48 Kinlaw Drive, Tabor City, NC 28463
MLS# 100550338Listed by: J. RAY REALTY, LLC $174,000Pending2 beds 1 baths1,008 sq. ft.
114 Nesmith Street, Tabor City, NC 28463
MLS# 100550123Listed by: LPT REALTY $575,000Active2 beds 1 baths1,354 sq. ft.
782 New Life Church Road, Tabor City, NC 28463
MLS# 100549840Listed by: THE SALTWATER AGENCY $274,900Pending3 beds 2 baths2,169 sq. ft.
108 N Franklin Street, Whiteville, NC 28472
MLS# 100549818Listed by: TATUM REALTY LLC $199,990Active3 beds 2 baths1,155 sq. ft.
78 Vintage Way, Tabor City, NC 28463
MLS# 2601459Listed by: WJH LLC $201,990Active3 beds 2 baths1,155 sq. ft.
84 Vintage Way, Tabor City, NC 28463
MLS# 2601462Listed by: WJH LLC $199,990Active3 beds 2 baths1,155 sq. ft.
90 Vintage Way, Tabor City, NC 28463
MLS# 2601465Listed by: WJH LLC $255,990Active4 beds 3 baths2,014 sq. ft.
91 Vintage Way, Tabor City, NC 28463
MLS# 2601466Listed by: WJH LLC $243,990Active4 beds 3 baths1,774 sq. ft.
70 Vintage Way, Tabor City, NC 28463
MLS# 2601468Listed by: WJH LLC $221,990Active4 beds 2 baths1,684 sq. ft.
56 Vintage Way, Tabor City, NC 28463
MLS# 2601443Listed by: WJH LLC $209,991Active3 beds 2 baths1,416 sq. ft.
62 Vintage Way, Tabor City, NC 28463
MLS# 2601446Listed by: WJH LLC $224,991Active4 beds 3 baths1,774 sq. ft.
36 Vintage Way, Tabor City, NC 28463
MLS# 2601429Listed by: WJH LLC $234,991Active4 beds 3 baths2,014 sq. ft.
44 Vintage Way, Tabor City, NC 28463
MLS# 2601437Listed by: WJH LLC $219,990Active4 beds 2 baths1,684 sq. ft.
22 Vintage Way, Tabor City, NC 28463
MLS# 2601406Listed by: WJH LLC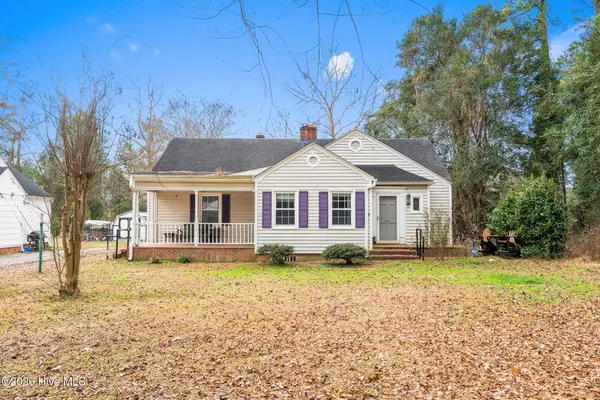 $220,000Active3 beds 1 baths1,543 sq. ft.
102 Sandwall Avenue, Tabor City, NC 28463
MLS# 100549588Listed by: INNOVATE REAL ESTATE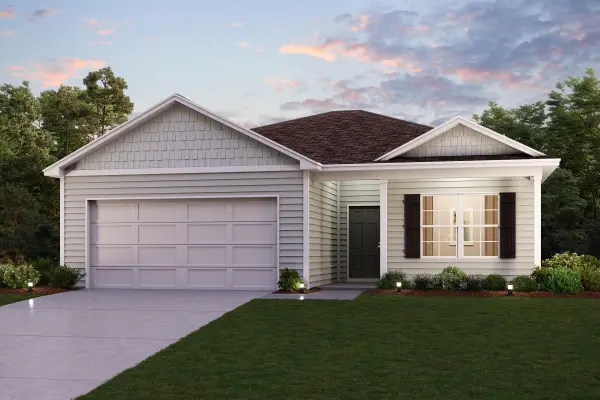 $209,990Active3 beds 2 baths1,416 sq. ft.
10 Vintage Way, Tabor City, NC 28463
MLS# 2601388Listed by: WJH LLC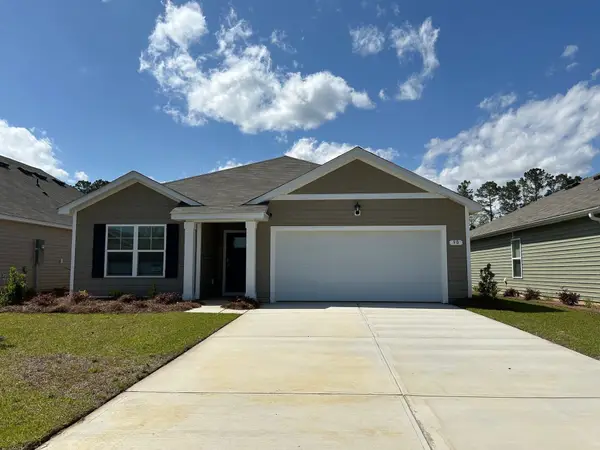 $252,490Active3 beds 2 baths2,179 sq. ft.
163 Ashworth Dr., Tabor City, NC 28463
MLS# 2601036Listed by: DR HORTON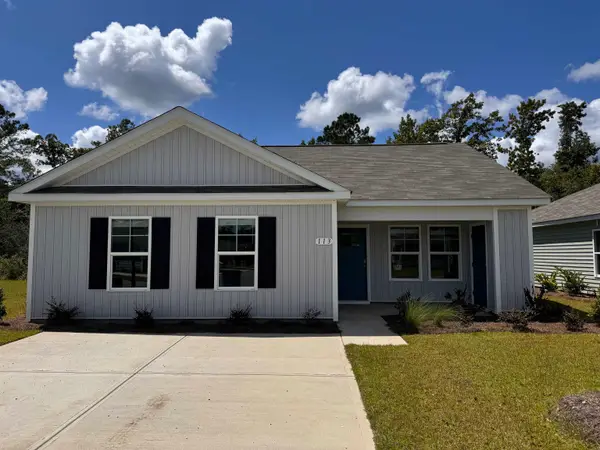 $218,490Active3 beds 2 baths1,272 sq. ft.
118 Ashworth Dr., Tabor City, NC 28463
MLS# 2601027Listed by: DR HORTON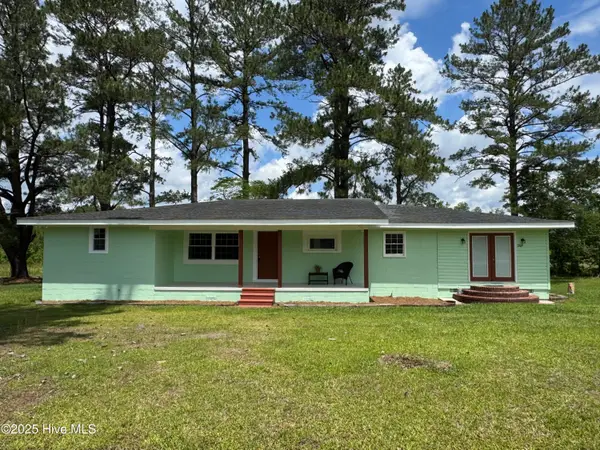 $249,900Active3 beds 2 baths2,128 sq. ft.
1309 Gaston Sellers Road, Whiteville, NC 28472
MLS# 100547785Listed by: HILTON AUCTION & REALTY INC-WHITEVILLE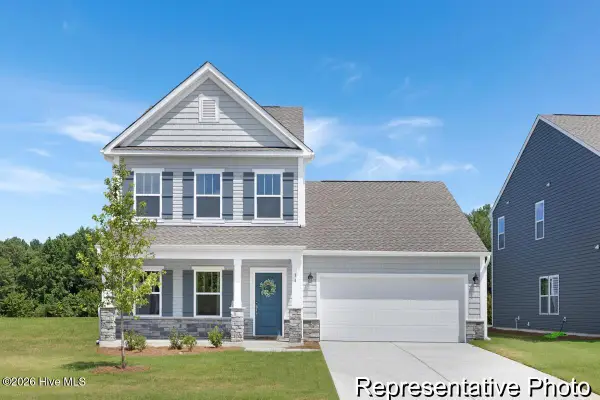 $299,900Active3 beds 3 baths2,098 sq. ft.
708 Grove Street #82, Whiteville, NC 28472
MLS# 100547743Listed by: TLS REALTY LLC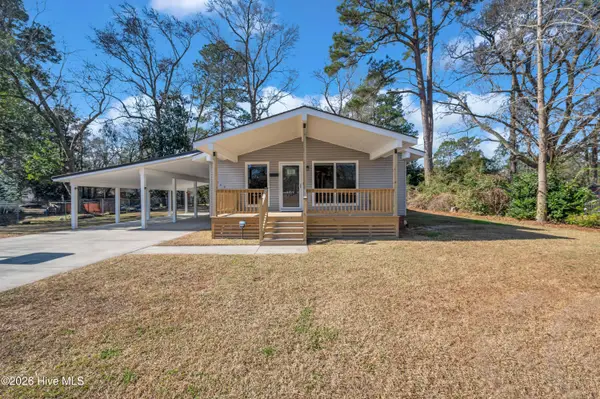 $239,500Active3 beds 2 baths1,260 sq. ft.
103 N Thompson Street, Whiteville, NC 28472
MLS# 100547625Listed by: KELLER WILLIAMS INNOVATE-KBT $480,000Active3 beds 4 baths2,190 sq. ft.
27 Stewart Circle, Whiteville, NC 28472
MLS# 100546342Listed by: J. RAY REALTY, LLC $499,900Pending4 beds 4 baths3,678 sq. ft.
701 Best Road, Whiteville, NC 28472
MLS# 100545999Listed by: LUMINA BLUE PROPERTIES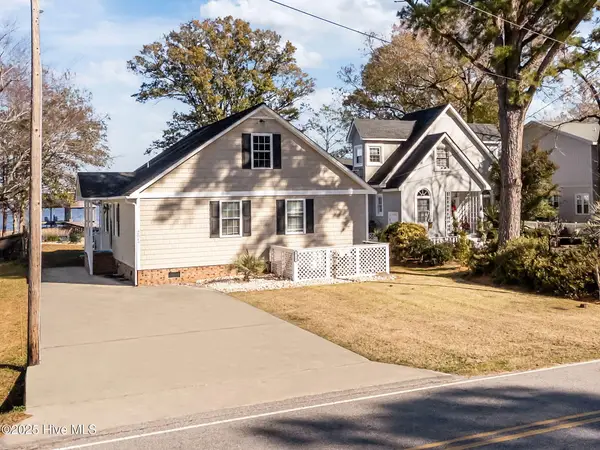 $629,000Active3 beds 2 baths1,252 sq. ft.
2517 Waccamaw Shores Road, Lake Waccamaw, NC 28450
MLS# 100545824Listed by: KELLER WILLIAMS CRYSTAL COAST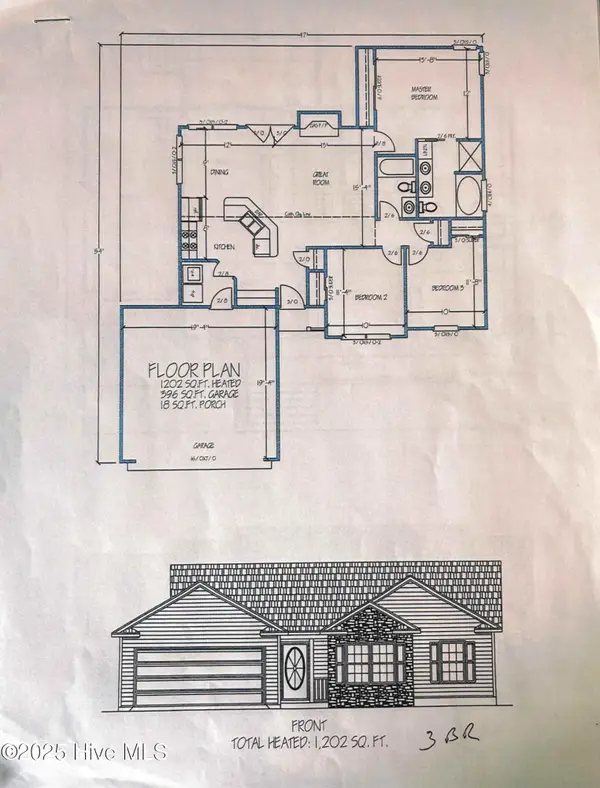 $253,000Active3 beds 2 baths1,202 sq. ft.
304 Miller Street, Chadbourn, NC 28431
MLS# 100545794Listed by: J. RAY REALTY, LLC $299,000Active3 beds 3 baths1,670 sq. ft.
948 Slippery Log Road, Whiteville, NC 28472
MLS# 100545707Listed by: FIRST CHOICE PRO REALTY $253,000Active3 beds 2 baths1,202 sq. ft.
107 Blanche Street, Chadbourn, NC 28431
MLS# 100545569Listed by: J. RAY REALTY, LLC $385,000Active4 beds 2 baths1,846 sq. ft.
347 Stewart Circle, Whiteville, NC 28472
MLS# 100545469Listed by: J. RAY REALTY, LLC $449,900Active3 beds 2 baths2,961 sq. ft.
50 Irvin Enzor Road S, Fair Bluff, NC 28439
MLS# 100544820Listed by: CAROLINA COASTAL REAL ESTATE $139,000Pending3 beds 2 baths1,618 sq. ft.
711 Bryce Street, Whiteville, NC 28472
MLS# 100544831Listed by: HILTON AUCTION & REALTY INC-WHITEVILLE $240,000Pending3 beds 2 baths1,260 sq. ft.
216 E Webster Street, Whiteville, NC 28472
MLS# 100544584Listed by: J. RAY REALTY, LLC $195,000Pending3 beds 2 baths1,354 sq. ft.
203 Northwood Drive, Whiteville, NC 28472
MLS# 100544529Listed by: J. RAY REALTY, LLC $492,000Active4 beds 4 baths2,907 sq. ft.
184 Timber Cove Drive, Whiteville, NC 28472
MLS# 100544114Listed by: CAROLINA COAST HOMES REAL ESTATE LLC $114,000Active3 beds 2 baths1,920 sq. ft.
115 S Franklin Street, Whiteville, NC 28472
MLS# 100544100Listed by: ATLANTIC BLUE COAST REALTY LLC $78,700Active2 beds 1 baths1,405 sq. ft.
41 Twin Pines Road, Whiteville, NC 28472
MLS# 100543767Listed by: COASTAL GREEN PROPERTIES, INC. $525,000Active3 beds 2 baths1,389 sq. ft.
2810 Canal Cove Road, Lake Waccamaw, NC 28450
MLS# 100543685Listed by: HILTON AUCTION & REALTY INC-WHITEVILLE $339,000Active3 beds 4 baths2,250 sq. ft.
505 N Madison Street, Whiteville, NC 28472
MLS# 100543227Listed by: WACCAMAW REAL ESTATE $230,000Active3 beds 3 baths2,240 sq. ft.
88 Country Club Road, Whiteville, NC 28472
MLS# 100542999Listed by: ATLANTIC BLUE COAST REALTY LLC $179,900Pending2 beds 1 baths1,284 sq. ft.
813 James Street, Whiteville, NC 28472
MLS# 100542447Listed by: TATUM REALTY LLC $299,900Pending2 beds 2 baths1,270 sq. ft.
316 Old Lumberton Road, Whiteville, NC 28472
MLS# 100542481Listed by: J. RAY REALTY, LLC $219,000Active3 beds 2 baths1,282 sq. ft.
209 Ashworth Drive, Tabor City, NC 28463
MLS# 100541546Listed by: KELLER WILLIAMS INNOVATE-OIB MAINLAND $465,000Active4 beds 3 baths2,399 sq. ft.
11230 Peacock Flower Street, Cypress, TX 77433
MLS# 10708479Listed by: WEEKLEY PROPERTIES BEVERLY BRADLEY $395,000Pending3 beds 2 baths1,953 sq. ft.
11207 Peacock Flower Street, Cypress, TX 77433
MLS# 77410663Listed by: WEEKLEY PROPERTIES BEVERLY BRADLEY $299,000Active3 beds 1 baths1,551 sq. ft.
92 Powell Loop, Whiteville, NC 28472
MLS# 100541435Listed by: J. RAY REALTY, LLC $299,500Active5 beds 4 baths2,850 sq. ft.
33 Gapway Road, Fair Bluff, NC 28439
MLS# 100541456Listed by: ONLY WAY REALTY CAROLINA GRAND STRAND PROPERTIES $439,900Active3 beds 2 baths2,578 sq. ft.
12268 Joe Brown Highway S, Tabor City, NC 28463
MLS# 100540633Listed by: BH & G ELLIOTT COASTAL LIVING $450,000Pending4 beds 3 baths2,617 sq. ft.
11234 Peacock Flower Street, Cypress, TX 77433
MLS# 22025371Listed by: WEEKLEY PROPERTIES BEVERLY BRADLEY $389,000Active3 beds 3 baths1,904 sq. ft.
842 Love Mill Road, Whiteville, NC 28472
MLS# 100540305Listed by: FIRST CHOICE PRO REALTY $390,000Active3 beds 2 baths2,104 sq. ft.
75 Pineland Woods Drive, Whiteville, NC 28472
MLS# 100540176Listed by: COLDWELL BANKER SEA COAST ADVANTAGE-LELAND $470,000Active2 beds 1 baths858 sq. ft.
204 Lakeshore Drive, Lake Waccamaw, NC 28450
MLS# 100538504Listed by: COLDWELL BANKER SEA COAST ADVANTAGE-LELAND $390,000Active4 beds 4 baths3,482 sq. ft.
211 Pireway Road, Tabor City, NC 28463
MLS# 100537209Listed by: REALTY ONE GROUP DOCKSIDE NORTH $228,000Active3 beds 2 baths1,783 sq. ft.
615 N Elm Street, Chadbourn, NC 28431
MLS# 100537984Listed by: ONLY WAY REALTY CAROLINA GRAND STRAND PROPERTIES $211,900Active3 beds 2 baths1,422 sq. ft.
941 Hickman Rd., Tabor City, NC 28463
MLS# 2525551Listed by: CB SEA COAST ADVANTAGE MB $200,000Active3 beds 3 baths2,374 sq. ft.
62 Pine Top Lane, Whiteville, NC 28472
MLS# 100536472Listed by: EXP REALTY $279,900Active4 beds 2 baths2,442 sq. ft.
110 E Bell Street, Tabor City, NC 28463
MLS# 100536293Listed by: BURROUGHS & COMPANY, LLC $254,900Active3 beds 2 baths3,970 sq. ft.
215 N Elm Street, Chadbourn, NC 28431
MLS# 100535931Listed by: ONLY WAY REALTY CAROLINA GRAND STRAND PROPERTIES $169,000Active3 beds 1 baths1,064 sq. ft.
1312 Sunny Side Street, Whiteville, NC 28472
MLS# 100535737Listed by: J. RAY REALTY, LLC $169,900Active2 beds 1 baths976 sq. ft.
301 E Goodman Street, Fair Bluff, NC 28439
MLS# 100535725Listed by: J. RAY REALTY, LLC $179,000Active4 beds 2 baths1,808 sq. ft.
414 S Wilson Street, Chadbourn, NC 28431
MLS# 100535484Listed by: KELLER WILLIAMS INNOVATE-WILMINGTON $215,000Pending3 beds 2 baths1,440 sq. ft.
283 Kit Horne Road, Whiteville, NC 28472
MLS# 100535341Listed by: J. RAY REALTY, LLC $44,500Active3 beds 2 baths1,300 sq. ft.
177 Dudney Lane, Chadbourn, NC 28431
MLS# 100545267Listed by: BERKSHIRE HATHAWAY HOMESERVICES CAROLINA PREMIER PROPERTIES $849,900Active3 beds 2 baths2,401 sq. ft.
212 Lakeshore Drive, Lake Waccamaw, NC 28450
MLS# 100534572Listed by: KELLER WILLIAMS INNOVATE-WILMINGTON $50,000Active2 beds 1 baths1,150 sq. ft.
1010 Academy Street, Fair Bluff, NC 28439
MLS# 100534448Listed by: ONLY WAY REALTY CAROLINA GRAND STRAND PROPERTIES $140,000Pending3 beds 2 baths1,220 sq. ft.
351 Green Swamp Road S, Bolton, NC 28423
MLS# 100532828Listed by: REAL BROKER LLC $385,000Pending3 beds 2 baths1,698 sq. ft.
3412 Waccamaw Shores Road, Lake Waccamaw, NC 28450
MLS# 100532414Listed by: HUDSON ADVANTAGE REALTY $324,800Active3 beds 3 baths1,840 sq. ft.
250 Waccamaw Shores Road, Lake Waccamaw, NC 28450
MLS# 100532244Listed by: ATLANTIC BLUE COAST REALTY LLC $425,000Pending2 beds 2 baths2,170 sq. ft.
1341 Cedar Grove Church Road, Cerro Gordo, NC 28430
MLS# 100532018Listed by: HILTON AUCTION & REALTY INC-WHITEVILLE $44,000Active2 beds 1 baths875 sq. ft.
106 E 4th Avenue, Chadbourn, NC 28431
MLS# 100531970Listed by: ONLY WAY REALTY CAROLINA GRAND STRAND PROPERTIES $169,000Active3 beds 2 baths1,370 sq. ft.
1924 Millie Christine Road, Whiteville, NC 28472
MLS# 100530577Listed by: HILTON AUCTION & REALTY INC-WHITEVILLE $375,000Active5 beds 4 baths2,730 sq. ft.
103 Top Tobacco Road, Lake Waccamaw, NC 28450
MLS# 100528084Listed by: COLDWELL BANKER SEA COAST ADVANTAGE-LELAND $135,000Active-- beds 1 baths1,520 sq. ft.
4076 Cherry Grove Road, Cerro Gordo, NC 28430
MLS# 100526839Listed by: BERKSHIRE HATHAWAY HOMESERVICES CAROLINA PREMIER PROPERTIES $149,000Active3 beds 2 baths1,599 sq. ft.
190 Lealer Lyons Drive, Whiteville, NC 28472
MLS# 100526026Listed by: J. RAY REALTY, LLC $334,900Active2 beds 2 baths1,252 sq. ft.
1079 Charlie Williamson Road, Whiteville, NC 28472
MLS# 748160Listed by: EXP REALTY LLC $299,000Active3 beds 2 baths1,568 sq. ft.
11061 Peacock Road, Chadbourn, NC 28431
MLS# 100522720Listed by: ATLANTIC BLUE COAST REALTY LLC $261,900Active4 beds 2 baths1,396 sq. ft.
111 E Oliver Street, Whiteville, NC 28472
MLS# 100521963Listed by: SKB GLOBAL ENTERPRISES, INC. $240,000Active3 beds 1 baths1,248 sq. ft.
3665 Midway Drive, Whiteville, NC 28472
MLS# 100521509Listed by: BRUNSWICK COUNTY HOLMES REAL ESTATE $225,000Active3 beds 2 baths1,084 sq. ft.
711 Smith Lane, Bolton, NC 28423
MLS# 100521170Listed by: DESTINATION REALTY CORPORATION, LLC $289,000Active3 beds 3 baths1,620 sq. ft.
6447 James B White Highway S, Whiteville, NC 28472
MLS# 100520817Listed by: ATLANTIC BLUE COAST REALTY LLC $205,000Pending3 beds 2 baths1,268 sq. ft.
856 Pinewood Drive, Whiteville, NC 28472
MLS# LP751258Listed by: 1ST CHOICE REAL ESTATE $265,000Pending3 beds 2 baths1,905 sq. ft.
136 Brown Maultsby Road, Whiteville, NC 28472
MLS# 100519066Listed by: HILTON AUCTION & REALTY INC-WHITEVILLE $265,000Active3 beds 3 baths1,550 sq. ft.
13290 New Britton Highway E, Nakina, NC 28455
MLS# 100518737Listed by: EXP REALTY $289,000Active3 beds 2 baths2,457 sq. ft.
313 E 1st Avenue, Chadbourn, NC 28431
MLS# 100518483Listed by: NANCE REAL ESTATE $549,900Active4 beds 5 baths3,287 sq. ft.
25 Muirfield Drive, Whiteville, NC 28472
MLS# 100518479Listed by: HILTON AUCTION & REALTY INC-WHITEVILLE $439,000Active3 beds 3 baths1,812 sq. ft.
121 Schley Avenue, Lake Waccamaw, NC 28450
MLS# 100517871Listed by: PORT CITY PROPERTIES, INC $140,000Active2 beds 1 baths700 sq. ft.
108 S Lee Street, Whiteville, NC 28472
MLS# 100517087Listed by: ATLANTIC BLUE COAST REALTY LLC $357,000Pending3 beds 2 baths2,534 sq. ft.
109 Conway Road, Fair Bluff, NC 28439
MLS# 100516428Listed by: ONLY WAY REALTY CAROLINA GRAND STRAND PROPERTIES $259,000Active3 beds 2 baths1,806 sq. ft.
217 N Howard Street, Chadbourn, NC 28431
MLS# 100514485Listed by: WACCAMAW REAL ESTATE $100,000Pending2 beds 2 baths1,475 sq. ft.
5542 Old Us Highway 74, Chadbourn, NC 28431
MLS# 100506152Listed by: EXP REALTY $249,999Active3 beds 1 baths1,440 sq. ft.
809 Conway Road, Fair Bluff, NC 28439
MLS# 100506307Listed by: ATLANTIC BLUE COAST REALTY LLC $289,900Active3 beds 2 baths2,128 sq. ft.
1309 Gaston Sellers Road, Whiteville, NC 28472
MLS# 100507548Listed by: HILTON AUCTION & REALTY INC-WHITEVILLE $345,000Active3 beds 2 baths1,507 sq. ft.
525 Vineland Drive, Whiteville, NC 28472
MLS# 100500958Listed by: SKB GLOBAL ENTERPRISES, INC. $299,000Active4 beds 3 baths2,338 sq. ft.
320 Pinecrest Drive, Chadbourn, NC 28431
MLS# 100494393Listed by: GLORIA GREEN REALTY $240,000Active3 beds 2 baths1,726 sq. ft.
1375 Kenny Jordan Rd, Tabor City, NC 28463
MLS# 2505954Listed by: COASTAL FIRST PROPERTIES, LLC $295,000Active3 beds 2 baths1,700 sq. ft.
361 Country Club Road, Whiteville, NC 28472
MLS# 100493366Listed by: REAL BROKER LLC $289,000Active3 beds 3 baths2,238 sq. ft.
300 Mcarthur Street, Tabor City, NC 28463
MLS# 100484666Listed by: BH & G ELLIOTT COASTAL LIVING $270,490Pending4 beds 3 baths2,340 sq. ft.
48 Arbor Crest Lane, Tabor City, NC 28463
MLS# 100483567Listed by: D R HORTON, INC. $162,500Pending2 beds 1 baths1,260 sq. ft.
5253 Pleasant Plains Church Road, Whiteville, NC 28472
MLS# 100481899Listed by: COLDWELL BANKER SEA COAST ADVANTAGE $245,880Active3 beds 2 baths2,179 sq. ft.
71 Arbor Crest Ln., Tabor City, NC 28463
MLS# 2427873Listed by: DR HORTON $609,000Active3 beds 2 baths1,704 sq. ft.
3002 Canal Cove Road, Lake Waccamaw, NC 28450
MLS# 100560195Listed by: HILTON AUCTION & REALTY INC-WHITEVILLE $370,000Pending4 beds 3 baths2,710 sq. ft.
528 Ole Farm Trail, Whiteville, NC 28472
MLS# 100477121Listed by: J. RAY REALTY, LLC $119,000Pending3 beds 1 baths1,635 sq. ft.
716 W Burkhead Street, Whiteville, NC 28472
MLS# 100476696Listed by: ATLANTIC BLUE COAST REALTY LLC $245,000Active5 beds 3 baths2,600 sq. ft.
907 Smyrna Drive, Whiteville, NC 28472
MLS# 100474271Listed by: EXP REALTY $204,355Active3 beds 2 baths1,221 sq. ft.
230 Ashworth Dr., Tabor City, NC 28463
MLS# 2423273Listed by: DR HORTON $199,770Active2 beds 2 baths813 sq. ft.
244 Ashworth Drive, Tabor City, NC 28463
MLS# 100469909Listed by: D R HORTON, INC. $118,000Active3 beds 1 baths1,120 sq. ft.
213 W Burkhead Street, Whiteville, NC 28472
MLS# 100469709Listed by: CENTURY 21 THOMAS INCORPORATED DBA THOMAS REAL ESTATE, LLC $295,000Active3 beds 3 baths3,230 sq. ft.
201 E Bell Street, Tabor City, NC 28463
MLS# 100449964Listed by: ONLY WAY REALTY CAROLINA GRAND STRAND PROPERTIES $624,000Pending4 beds 3 baths1,584 sq. ft.
3506 Whitehall Road, Whiteville, NC 28472
MLS# 100430742Listed by: ADVANCE LAND AND TIMBER, LLC
Local realty services provided by:CENTURY 21 New Beginnings, CENTURY 21 Rucker Real Estate, CENTURY 21 Total Real Estate Solutions, CENTURY 21 The Harrelson Group, CENTURY 21 Judge Fite Company, CENTURY 21 The Realty Group
Listings courtesy of Canopy MLS as distributed by MLS GRID. Copyright 2021 Canopy MLS. All rights reserved. Canopy MLS, provides content displayed here (“provided content”) on an “as is” basis and makes no representations or warranties regarding the provided content, including, but not limited to those of non-infringement, timeliness, accuracy, or completeness. Individuals and companies using information presented are responsible for verification and validation of information they utilize and present to their customers and clients. Canopy MLS will not be liable for any damage or loss resulting from use of the provided content or the products available through Portals, IDX, VOW, and/or Syndication. Recipients of this information shall not resell, redistribute, reproduce, modify, or otherwise copy any portion thereof without the expressed written consent of Canopy MLS.
2026 Triad MLS, Inc. All rights reserved. IDX information is provided exclusively for personal, non-commercial use, and may not be used for any purpose other than to identify prospective properties consumers may be interested in purchasing. Information is deemed reliable but not guaranteed. This site will be monitored for ‘scraping’ and any use of search facilities of data on the site other than by potential buyers/sellers is prohibited. All Sale data is for informational purposes only and is not an indication of a market analysis or appraisal. Properties marked with the Triad MLS, Inc. icon are provided courtesy of the Triad MLS, Inc.’s, Internet Data Exchange Database.
Listings marked with a Doorify MLS icon are provided courtesy of the Doorify MLS, of North Carolina, Internet Data Exchange Database. Brokers make an effort to deliver accurate information, but buyers should independently verify any information on which they will rely in a transaction. The listing broker shall not be responsible for any typographical errors, misinformation, or misprints, and they shall be held totally harmless from any damages arising from reliance upon this data. This data is provided exclusively for consumers’ personal, non-commercial use. Copyright 2026 Doorify MLS of North Carolina. All rights reserved.
Provided courtesy of the Coastal Carolinas MLS. © 2026 of the Coastal Carolinas MLS. All rights reserved. Information is provided exclusively for consumers' personal, non-commercial use, and may not be used for any purpose other than to identify prospective properties consumers may be interested in purchasing. Data is deemed reliable but is not guaranteed accurate by the Coastal Carolinas MLS.
Copyright 2026, Houston Realtors Information Service, Inc. All information provided is deemed reliable but is not guaranteed and should be independently verified. IDX information is provided exclusively for consumers' personal, non-commercial use, it may not be used for any purpose other than to identify prospective properties consumers may be interested in purchasing, and the data is deemed reliable but is not guaranteed accurate by the MLS.
Popular searches near Columbus County, NC
Popular neighborhoods near Columbus County, NC
- Barefoot, North Myrtle Beach homes for sale
- Beach Cove Ocean Resort, North Myrtle Beach homes for sale
- Charleston Landing, North Myrtle Beach homes for sale
- Cherry Grove, North Myrtle Beach homes for sale
- Colonial Charters, Little River homes for sale
- Crescent Beach, North Myrtle Beach homes for sale
- Dunes Cove, Myrtle Beach homes for sale
- Eastport Golf Community, Little River homes for sale
- Grande Dunes, Myrtle Beach homes for sale
- Lafayette Park, Little River homes for sale
- Magnolia Greens, Leland homes for sale
- River Hills, Little River homes for sale
- Sun Colony, Little River homes for sale
- The Dunes, Myrtle Beach homes for sale
- The Farm at Carolina Forest, Myrtle Beach homes for sale
- Tidewater Plantation, North Myrtle Beach homes for sale
- Tilghman Estates, North Myrtle Beach homes for sale
- Waterbridge, Myrtle Beach homes for sale
- Waterford of the Carolinas, Leland homes for sale
- Windy Hill Beach, North Myrtle Beach homes for sale
Zip codes near Columbus County, NC
- 28420 homes for sale
- 28423 homes for sale
- 28430 homes for sale
- 28431 homes for sale
- 28432 homes for sale
- 28433 homes for sale
- 28434 homes for sale
- 28442 homes for sale
- 28450 homes for sale
- 28452 homes for sale
- 28455 homes for sale
- 28456 homes for sale
- 28462 homes for sale
- 28463 homes for sale
- 28467 homes for sale
- 28469 homes for sale
- 28470 homes for sale
- 28472 homes for sale
- 29545 homes for sale
- 29569 homes for sale
Protect your home and budget from life's surprises with an Assurant Home Warranty, backed by a partner that supports you through every step of homeownership. Explore Plans.
©2026 Century 21 Real Estate LLC. All rights reserved. CENTURY 21®, the CENTURY 21 Logo and C21® are service marks owned by Century 21 Real Estate LLC. Century 21 Real Estate LLC fully supports the principles of the Fair Housing Act and the Equal Opportunity Act. Each office is independently owned and operated. Listing information is deemed reliable but not guaranteed accurate.