- Adel homes for sale
- Adel-Sparks homes for sale
- Ashburn homes for sale
- Ashburn-Sycamore homes for sale
- Brookfield homes for sale
- Chula homes for sale
- Chula homes for sale
- Eldorado homes for sale
- Enigma homes for sale
- Fitzgerald homes for sale
- Irwinville homes for sale
- Nashville homes for sale
- Ocilla homes for sale
- Poulan homes for sale
- Sparks homes for sale
- Sumner homes for sale
- Sycamore homes for sale
- Tifton homes for sale
- Ty Ty homes for sale
- Unionville homes for sale
31794, GA - homes for sale
130 of 130 results displayed
- New
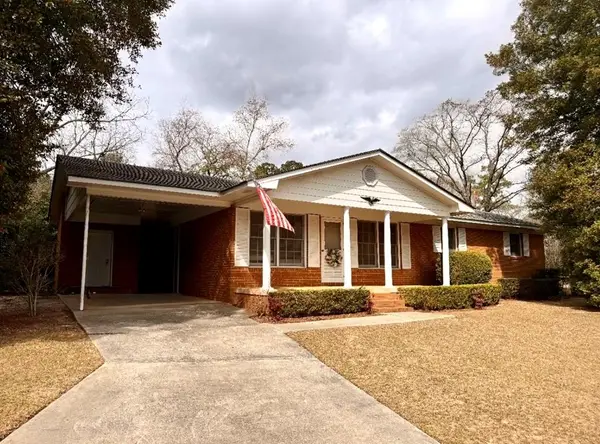
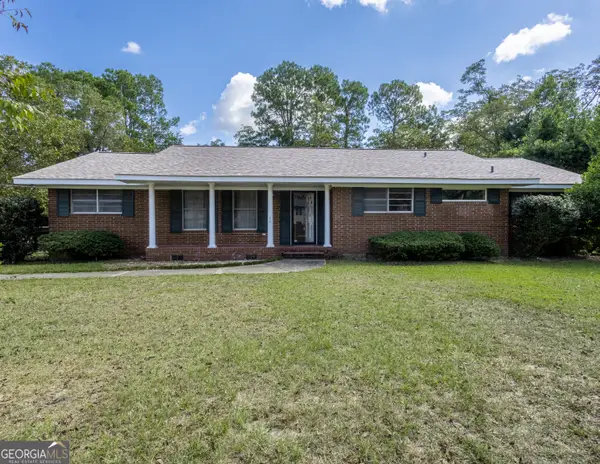
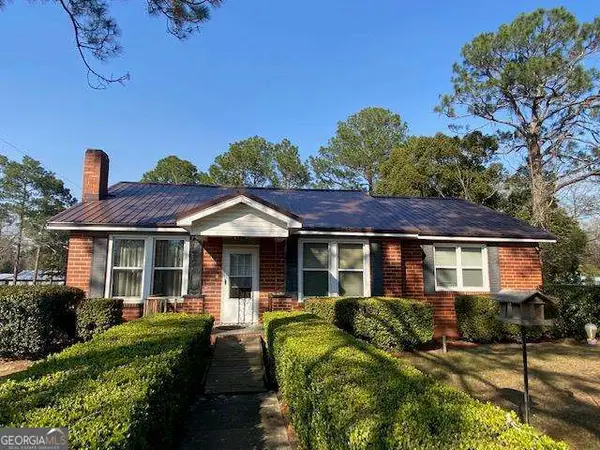 $82,500Active3 beds 1 baths1,476 sq. ft.
215 W 13th Street, Tifton, GA 31794
MLS# 10721307Listed by: Southern Classic Realtors
- New
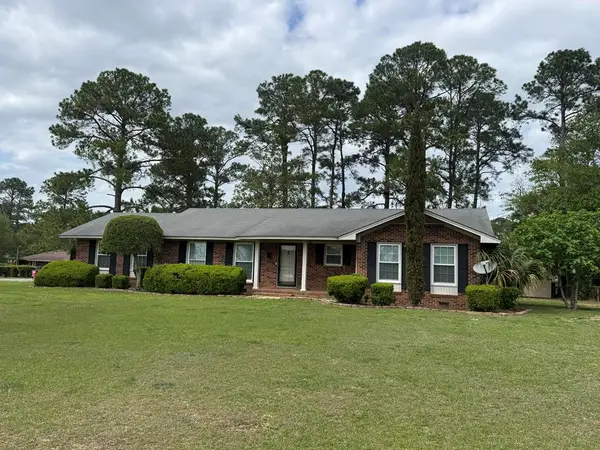 $239,500Active3 beds 2 baths1,679 sq. ft.
819 Florida, Tifton, GA 31794
MLS# 142474Listed by: KELLER WILLIAMS GEORGIA COMMUNITIES - New
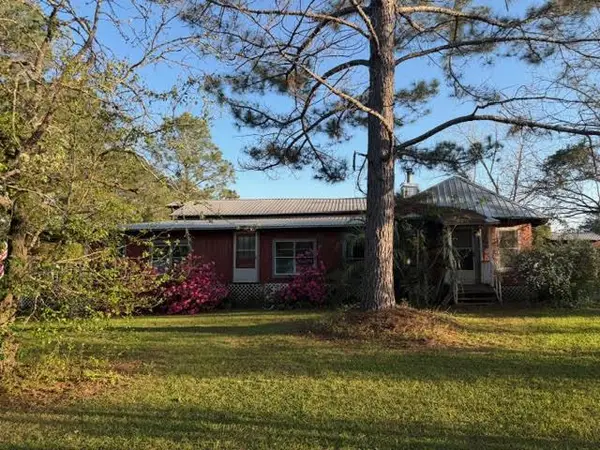
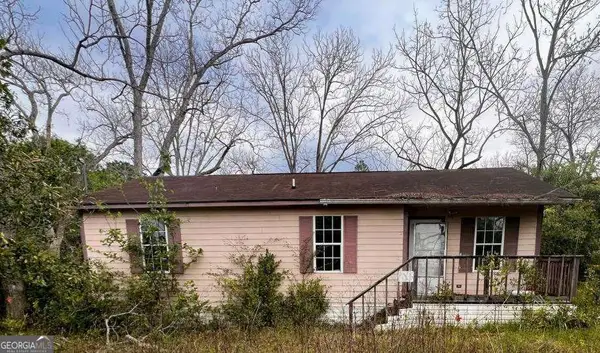 $39,900Active3 beds 2 baths984 sq. ft.
325 Golden Road E, Tifton, GA 31794
MLS# 10720336Listed by: TOP Brokerage - New
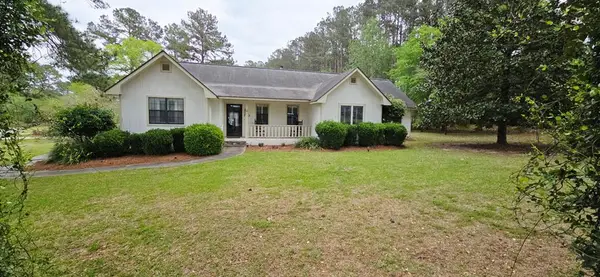
 $332,000Active3 beds 2 baths2,324 sq. ft.
7203 Doss Dr, Tifton, GA 31794
MLS# 142468Listed by: CENTURY 21 SMITH BRANCH, LLC. - New
 $240,000Active3 beds 2 baths1,377 sq. ft.
319 319 Irwin Street, Tifton, GA 31794
MLS# 142464Listed by: ADVANTAGE REALTY PARTNERS LLC - New
 $250,000Active5 beds 4 baths2,920 sq. ft.
1076 Wiley Branch Rd, Tifton, GA 31794
MLS# 142462Listed by: ADVANTAGE REALTY PARTNERS LLC - New
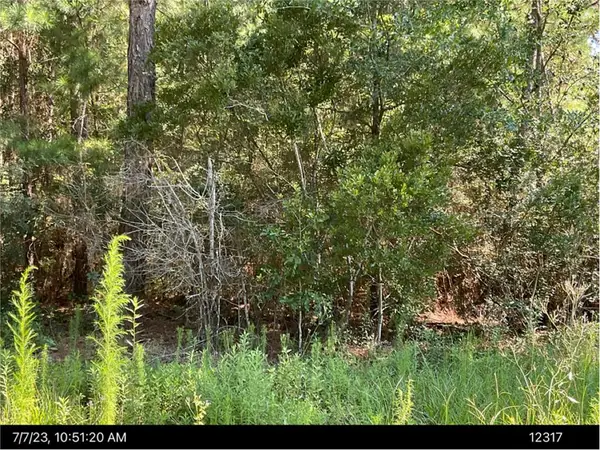 $25,000Active0.77 Acres
N/A Wanda Way, Tifton, GA 31794
MLS# 153108Listed by: SIGNATURE CHOICE REALTY - New
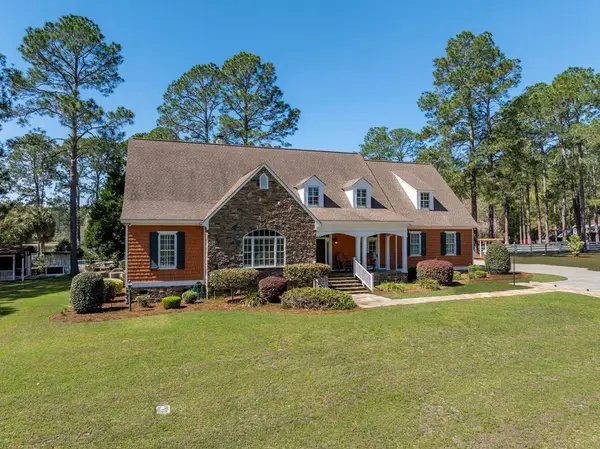 $899,000Active4 beds 5 baths3,972 sq. ft.
5308 Forest Lake Dr., Tifton, GA 31793
MLS# 142455Listed by: ADVANTAGE REALTY PARTNERS LLC - New
 $262,000Active3 beds 2 baths
1001 Prince Avenue #6, Tifton, GA 31794
MLS# 10717839Listed by: Keller Williams Georgia Communities - New
 $297,500Active3 beds 2 baths1,652 sq. ft.
105 Turtle Cove Lane, Tifton, GA 31794
MLS# 10717489Listed by: Coldwell Banker Active Real Estate - New
 $279,000Active3 beds 2 baths1,524 sq. ft.
907 E 46th St, Tifton, GA 31794
MLS# 142446Listed by: POPE, THE REAL ESTATE COMPANY - New
 $299,999Active4 beds 3 baths2,129 sq. ft.
817 Murray Ave, Tifton, GA 31794
MLS# 142444Listed by: POPE, THE REAL ESTATE COMPANY  $307,000Active4 beds 3 baths
603 E 48th Street #243, Tifton, GA 31794
MLS# 10714485Listed by: Southern Classic Realtors $420,000Active5 beds 3 baths3,550 sq. ft.
35 Delma Ln, Tifton, GA 31794
MLS# 142417Listed by: POPE, THE REAL ESTATE COMPANY $195,000Active4 beds 2 baths1,629 sq. ft.
801 Belmont Ave, Tifton, GA 31794
MLS# 142411Listed by: CENTURY 21 SMITH, BRANCH LLC - SYLVESTER $295,900Active3 beds 2 baths1,594 sq. ft.
204 Turtle Cove Lane, Tifton, GA 31794
MLS# 10710300Listed by: Keller Williams Georgia Communities $380,000Active3 beds 4 baths2,306 sq. ft.
603 40th, Tifton, GA 31794
MLS# 142403Listed by: POPE, THE REAL ESTATE COMPANY $239,900Active3 beds 2 baths
539 Osprey Circle, Tifton, GA 31794
MLS# 10707047Listed by: Coldwell Banker Active Real Estate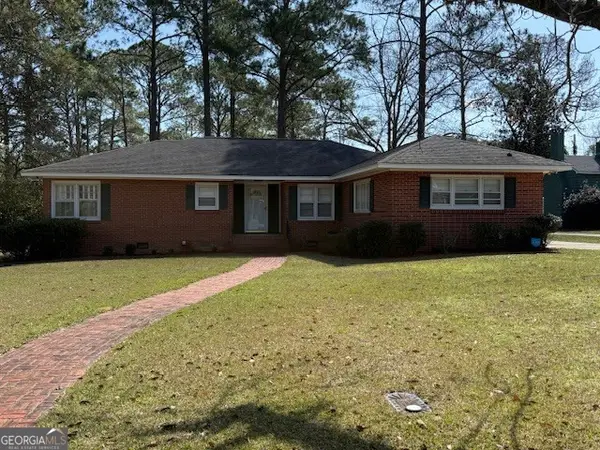 $329,900Active3 beds 2 baths2,514 sq. ft.
1221 Ridge Avenue N, Tifton, GA 31794
MLS# 10702795Listed by: Southern Classic Realtors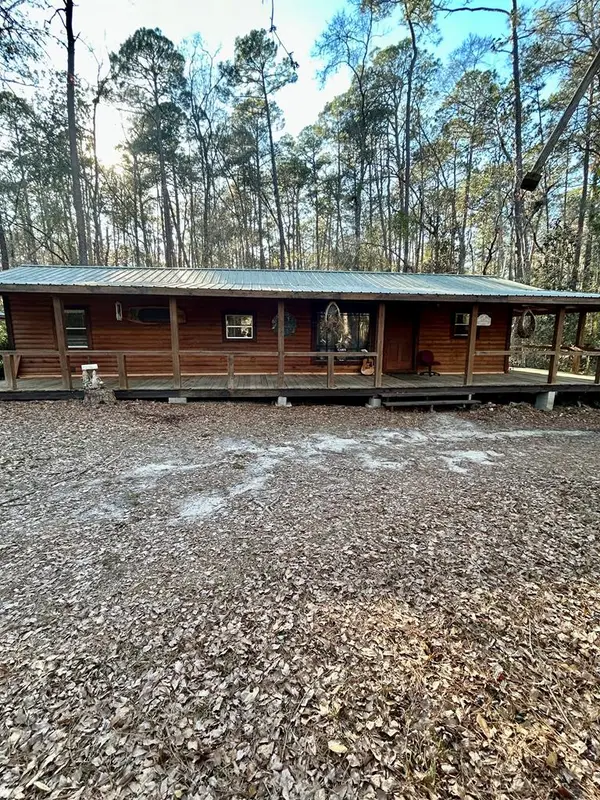 $179,000Active2 beds 2 baths1,100 sq. ft.
405 Gun Lake Circle, Tifton, GA 31794
MLS# 141383Listed by: SOUTHERN CLASSIC REALTORS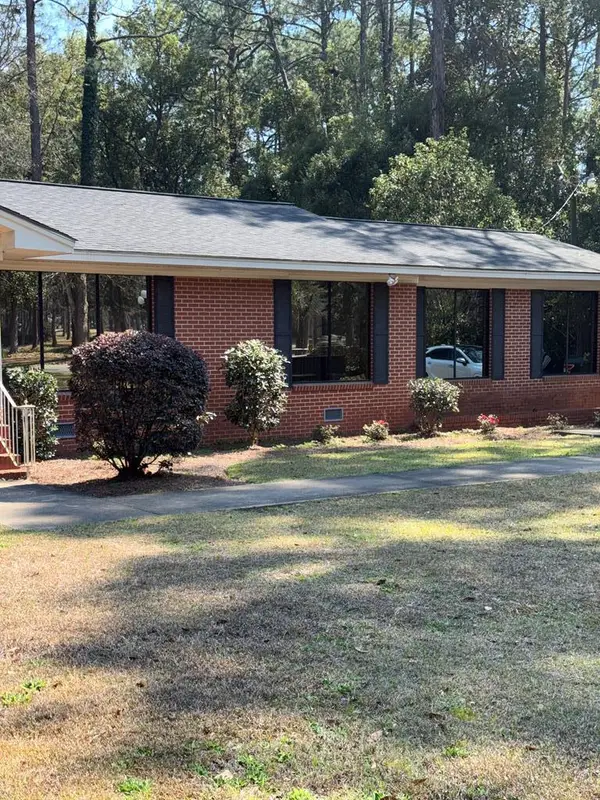 $262,000Active3 beds 2 baths2,014 sq. ft.
1001 Prince Avenue, Tifton, GA 31794
MLS# 141378Listed by: KELLER WILLIAMS GEORGIA COMMUNITIES $725,000Active5 beds 4 baths4,500 sq. ft.
303 West 26th Street, Tifton, GA 31794
MLS# 141373Listed by: POPE, THE REAL ESTATE COMPANY $167,500Active3 beds 2 baths1,456 sq. ft.
1635 E Us Highway 82, Tifton, GA 31794
MLS# 10698918Listed by: Coldwell Banker Active Real Estate $279,500Active3 beds 2 baths1,992 sq. ft.
1444 Madison Ave, Tifton, GA 31794
MLS# 141363Listed by: SOUTHERN CLASSIC REALTORS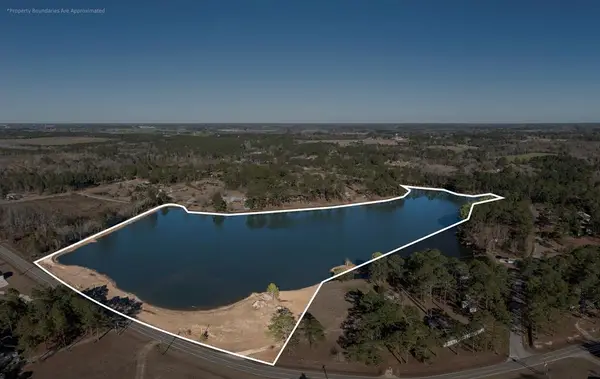 $179,900Active28.34 Acres
5491 Union Rd, Tifton, GA 31794
MLS# 141356Listed by: KUNES REAL ESTATE & APPRAISALS $429,900Active3 beds 2 baths1,352 sq. ft.
35 Lake Larry Drive, Tifton, GA 31794
MLS# 141357Listed by: KUNES REAL ESTATE & APPRAISALS $770,000Active1.16 Acres
0 N Tift Ave, Tifton, GA 31794
MLS# 141346Listed by: ADVANTAGE REALTY PARTNERS LLC $275,000Active5 beds 2 baths2,228 sq. ft.
14268 N Hwy 125, Tifton, GA 31794
MLS# 10693900Listed by: Beycome Brokerage Realty LLC $167,500Active3 beds 2 baths1,269 sq. ft.
2014 Tyson, Tifton, GA 31794
MLS# 141332Listed by: COLDWELL BANKER ACTIVE REAL ESTATE $669,000Active2 beds 2 baths2,540 sq. ft.
277 Wesley Rigdon Rd, Tifton, GA 31794
MLS# 141324Listed by: POPE, THE REAL ESTATE COMPANY $229,900Active3 beds 2 baths1,804 sq. ft.
2209 Meadowbrook Drive, Tifton, GA 31794
MLS# 149684Listed by: LANDMARK REALTY AND INVESTMENTS, LLC $399,900Active3 beds 3 baths4,184 sq. ft.
897 Wiley Branch Road, Tifton, GA 31794
MLS# 10692695Listed by: Keller Williams Georgia Communities $277,000Active2 beds 2 baths1,684 sq. ft.
1775 Ferry Lake Rd, Tifton, GA 31794
MLS# 141319Listed by: POPE, THE REAL ESTATE COMPANY $299,900Active3 beds 2 baths1,765 sq. ft.
225 Cypress Ridge Rd, Tifton, GA 31793
MLS# 141317Listed by: ADVANTAGE REALTY PARTNERS LLC $273,000Active3 beds 2 baths1,418 sq. ft.
720 Osprey Circle, Tifton, GA 31794
MLS# 141316Listed by: KELLER WILLIAMS GEORGIA COMMUNITIES $414,000Active4 beds 2 baths2,710 sq. ft.
2020 N Murray, Tifton, GA 31794
MLS# 141314Listed by: SOUTHERN CLASSIC REALTORS $499,000Active4 beds 3 baths5,090 sq. ft.
901 Wiley Branch Road, Tifton, GA 31794
MLS# 141311Listed by: KELLER WILLIAMS GEORGIA COMMUNITIES $419,000Active3 beds 3 baths2,350 sq. ft.
2605 Murray Ave, Tifton, GA 31794
MLS# 141305Listed by: POPE, THE REAL ESTATE COMPANY $286,000Active3 beds 2 baths1,669 sq. ft.
557 Osprey Circle, Tifton, GA 31794
MLS# 141299Listed by: ADVANTAGE REALTY PARTNERS LLC $90,000Active2 beds 1 baths924 sq. ft.
309 309 Elm St, Tifton, GA 31794
MLS# 15531Listed by: KELLER WILLIAMS TOWN & COUNTRY REALTY $310,000Active3 beds 2 baths1,100 sq. ft.
305 Magnolia Drive N, Eden, GA
MLS# SA348165Listed by: SEAPORT REAL ESTATE GROUP $1,733,400Active192.6 Acres
0 Tifton Eldorado Rd, Tifton, GA 31793
MLS# 141261Listed by: POPE, THE REAL ESTATE COMPANY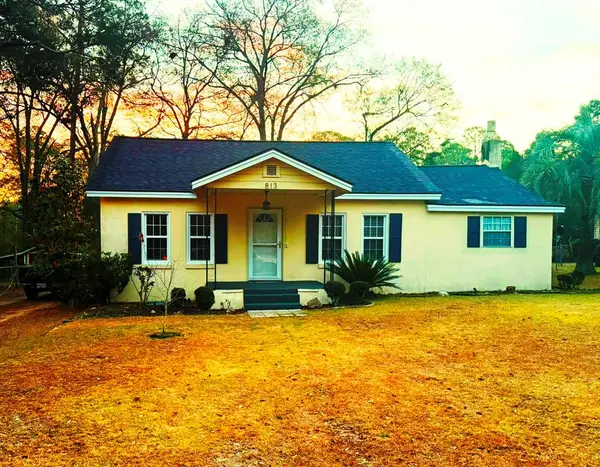 $178,900Active2 beds 2 baths1,438 sq. ft.
813 Belmont Ave., Tifton, GA 31794
MLS# 141259Listed by: CENTURY 21 SMITH BRANCH, LLC.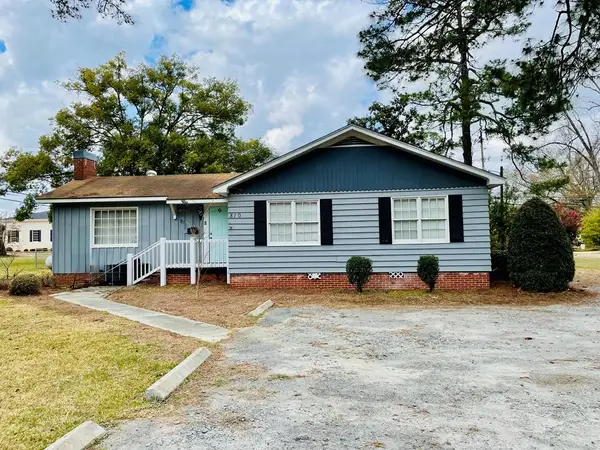 $220,000Active3 beds 3 baths1,886 sq. ft.
810 N Tift Ave, Tifton, GA 31794
MLS# 141256Listed by: ADVANTAGE REALTY PARTNERS LLC $254,000Active3 beds 2 baths1,732 sq. ft.
109 Cypress Ridge Road, Tifton, GA 31794
MLS# 926446Listed by: BROADWAY REAL ESTATE $130,000Active3 beds 2 baths
1513 Pickard Avenue, Tifton, GA 31794
MLS# 10682704Listed by: Real Broker LLC $239,000Active3 beds 2 baths1,440 sq. ft.
15 Mcgee Rd, Enigma, GA 31749
MLS# 140236Listed by: POPE, THE REAL ESTATE COMPANY $205,000Active3 beds 2 baths1,450 sq. ft.
23 Brookfield Lenox Rd, Tifton, GA 31794
MLS# 140234Listed by: CENTURY 21 SMITH BRANCH, LLC.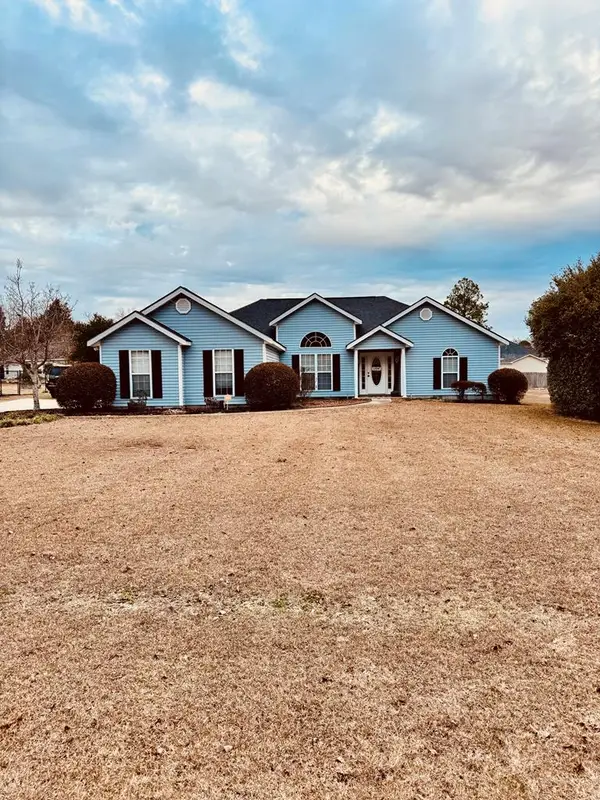 $307,000Active4 beds 3 baths1,972 sq. ft.
603 E 48th Street, Tifton, GA 31794
MLS# 140227Listed by: SOUTHERN CLASSIC REALTORS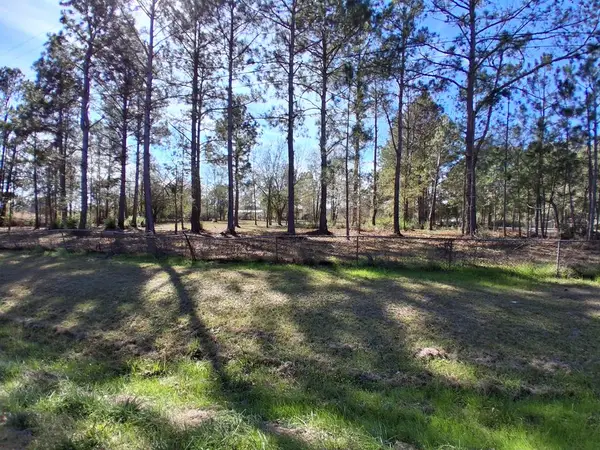 $120,000Active2.03 Acres
0 South Hwy 125 Rd, Tifton, GA 31694
MLS# 148425Listed by: COLDWELL BANKER PREMIER REAL E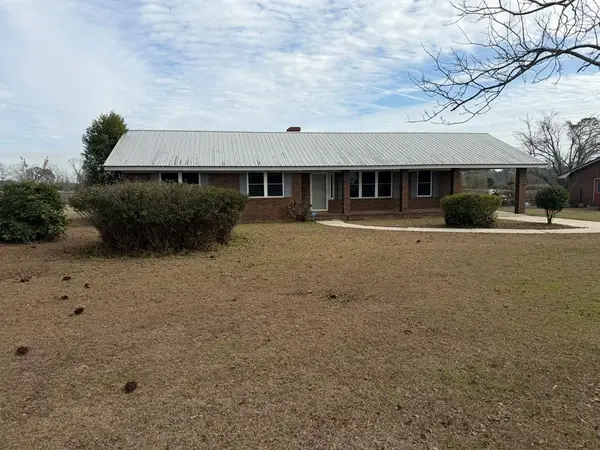 $250,000Active3 beds 2 baths2,420 sq. ft.
529 Tifton Eldorado Rd, Tifton, GA 31794
MLS# 140213Listed by: ADVANTAGE REALTY PARTNERS LLC $105,000Active4 beds 3 baths
2900 6th Avenue, Tifton, GA 31794
MLS# 10675334Listed by: Southern Classic Realtors $100,000Pending4 beds 3 baths2,128 sq. ft.
2900 6th Ave, Tifton, GA 31794
MLS# 148366Listed by: SOUTHERN CLASSIC REALTORS $272,000Active3 beds 2 baths1,938 sq. ft.
905 Florida Drive, Tifton, GA 31794
MLS# 10673124Listed by: Listed Simply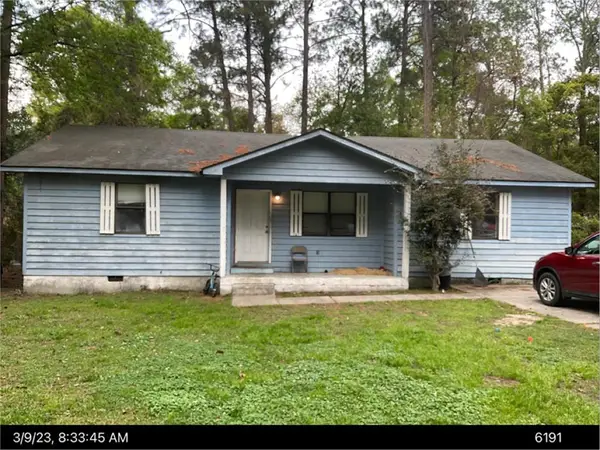 $119,000Active3 beds 2 baths1,302 sq. ft.
1209 Sussex Drive, Tifton, GA 31794
MLS# 140184Listed by: CENTURY 21 SMITH BRANCH, LLC. $874,823Active175 Acres
0 Omega Eldorado Rd, Tifton, GA 31793
MLS# 139182Listed by: POPE, THE REAL ESTATE COMPANY $601,959Active4 beds 4 baths3,675 sq. ft.
801 W 8th, Tifton, GA 31794
MLS# 139175Listed by: SOUTHERN CLASSIC REALTORS $89,900Active2 beds 1 baths800 sq. ft.
724 6 1/2 Street, Tifton, GA 31794
MLS# 10644988Listed by: Southern Classic Realtors $515,000Active4 beds 3 baths3,134 sq. ft.
2615 Hall Ave, Tifton, GA 31794
MLS# 139164Listed by: POPE, THE REAL ESTATE COMPANY $268,800Active3 beds 2 baths1,401 sq. ft.
628 Whitetail, Tifton, GA 31794
MLS# 139143Listed by: POPE, THE REAL ESTATE COMPANY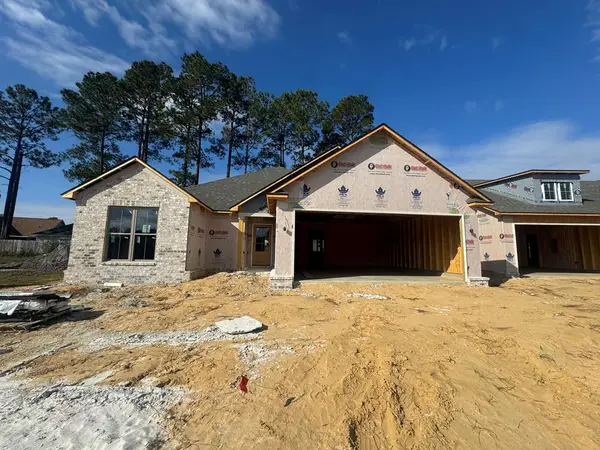 $288,500Active3 beds 2 baths1,518 sq. ft.
630 Whitetail Ln, Tifton, GA 31794
MLS# 139144Listed by: POPE, THE REAL ESTATE COMPANY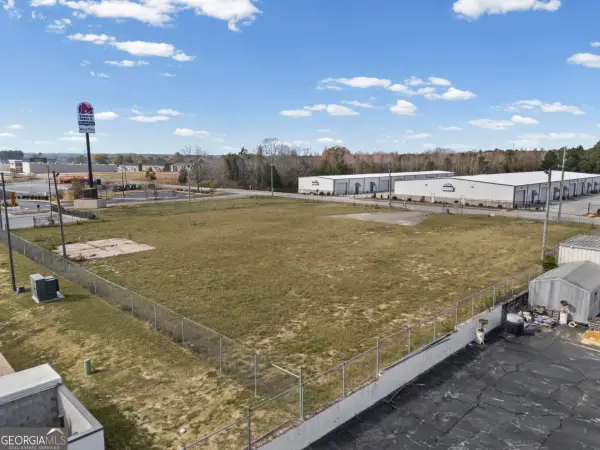 $1,200,000Active0.97 Acres
0 Hunt Road, Tifton, GA 31794
MLS# 10663104Listed by: Keller Williams Georgia Communities $686,615Active129.55 Acres
0 Stonebridge Rd, Tifton, GA 31794
MLS# 139116Listed by: KUNES REAL ESTATE & APPRAISALS $435,000Active3 beds 2 baths2,564 sq. ft.
536 Osprey Circle, Tifton, GA 31794
MLS# 139113Listed by: SOUTHERN CLASSIC REALTORS $50,000Active3 beds 1 baths874 sq. ft.
1911 Park Avenue S, Tifton, GA 31794
MLS# 10657091Listed by: BHHS Georgia Properties $219,000Active3 beds 2 baths1,564 sq. ft.
2014 N Davis Ave, Tifton, GA 31794
MLS# 139109Listed by: SOUTHERN CLASSIC REALTORS $185,000Active3 beds 3 baths2,247 sq. ft.
801 E 12th Street, Tifton, GA 31794
MLS# 10655746Listed by: Southern Classic Realtors $299,999Active4 beds 3 baths2,738 sq. ft.
222 Alabama, Tifton, GA 31794
MLS# 139101Listed by: POPE, THE REAL ESTATE COMPANY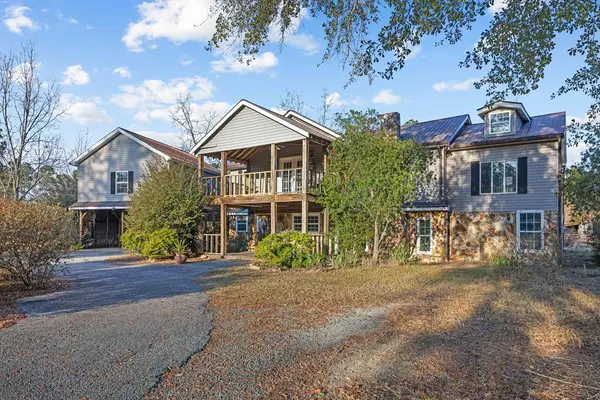 $394,000Active4 beds 2 baths4,236 sq. ft.
14084 Hwy 125n, Tifton, GA 31794
MLS# 146959Listed by: THE HERNDON COMPANY $89,900Active2 beds 1 baths800 sq. ft.
724 6 1/2 St, Tifton, GA 31794
MLS# 139047Listed by: SOUTHERN CLASSIC REALTORS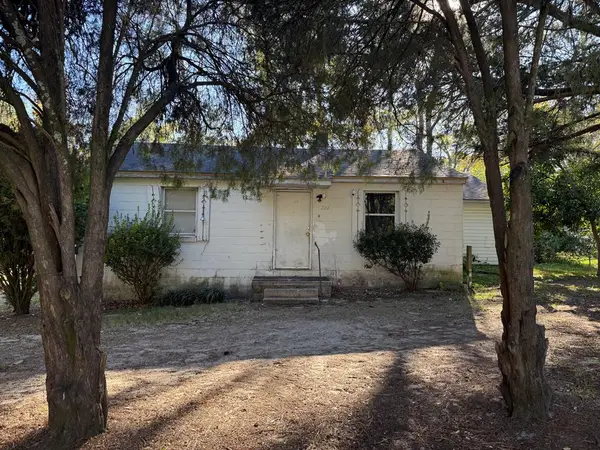 $144,900Active2 beds 1 baths1,469 sq. ft.
722 6 1/2 St, Tifton, GA 31794
MLS# 139048Listed by: SOUTHERN CLASSIC REALTORS
 $914,200Active4 beds 6 baths4,499 sq. ft.
68 Rose Ave, Tifton, GA 31794
MLS# 139044Listed by: CENTURY 21 SMITH BRANCH, LLC.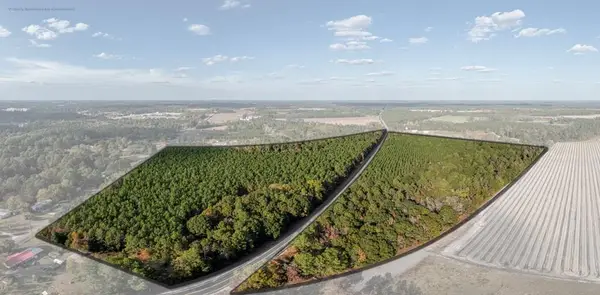 $975,000Active69.48 Acres
0 N Us Hwy 319, Tifton, GA 31794
MLS# 139031Listed by: POPE, THE REAL ESTATE COMPANY $50,000Active3.46 Acres
0 Belflower Rd, Tifton, GA 31794
MLS# 139026Listed by: ADVANTAGE REALTY PARTNERS LLC $49,900Active2 beds 1 baths1,132 sq. ft.
1910 S Park Avenue, Tifton, GA 31794
MLS# 10638276Listed by: Southern Classic Realtors $249,900Active3 beds 2 baths1,604 sq. ft.
746 Chula Brookfield Rd, Tifton, GA 31794
MLS# 138998Listed by: POPE, THE REAL ESTATE COMPANY $90,000Active0.41 Acres
1611 Love, Tifton, GA 31794
MLS# 138979Listed by: COLDWELL BANKER ACTIVE REAL ESTATE $225,000Active3 beds 2 baths1,930 sq. ft.
711 W 10th Street, Tifton, GA 31794
MLS# 138978Listed by: KELLER WILLIAMS GEORGIA COMMUNITIES $399,000Active6 beds 4 baths3,998 sq. ft.
2021 N Emory Drive, Tifton, GA 31794
MLS# 138977Listed by: SOUTHERN CLASSIC REALTORS $225,000Active3 beds 2 baths1,638 sq. ft.
2417 Belmont Ave, Tifton, GA 31794
MLS# 138962Listed by: SOUTHERN CLASSIC REALTORS $339,900Active3 beds 3 baths2,280 sq. ft.
2214 Love Avenue, Tifton, GA 31794
MLS# 138947Listed by: KELLER WILLIAMS GEORGIA COMMUNITIES $59,900Active1.3 Acres
0 Penn Place, Tifton, GA 31794
MLS# 138937Listed by: SOUTHERN CLASSIC REALTORS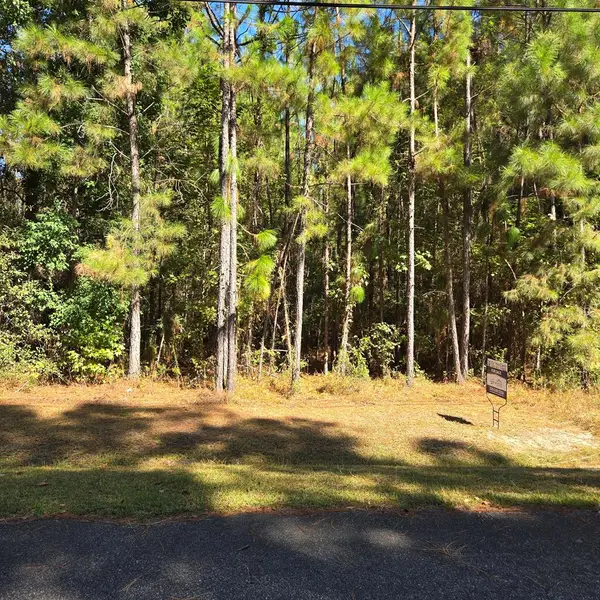 $21,000Pending0.71 Acres
N/A Wanda Way, Tifton, GA 31794
MLS# 146373Listed by: SIGNATURE CHOICE REALTY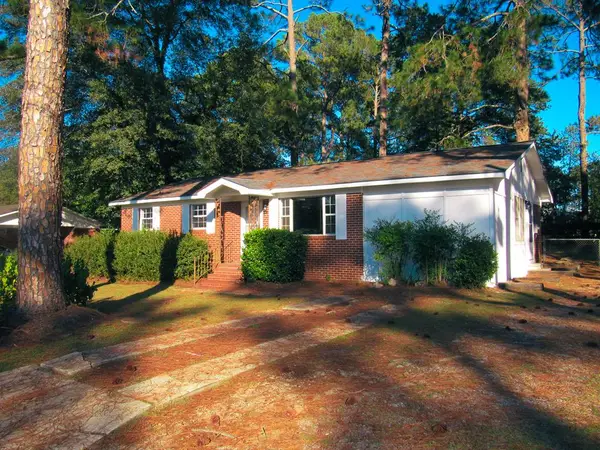 $209,000Active3 beds 2 baths1,344 sq. ft.
1809 Davis, Tifton, GA 31794
MLS# 138893Listed by: D COLEMAN REALTY GROUP LLC $285,000Active4 beds 3 baths2,733 sq. ft.
225 Alabama Drive, Tifton, GA 31794
MLS# 10615247Listed by: Keller Williams Georgia Communities $598,066Active6.15 Acres
0 Kent Road, Tifton, GA 31794
MLS# 138874Listed by: POPE, THE REAL ESTATE COMPANY $119,000Active4 beds 3 baths2,352 sq. ft.
409 Davis Avenue, Tifton, GA 31794
MLS# 7650087Listed by: CHAPMAN HALL REALTORS $55,000Active6.8 Acres
LOT 224 Chula Brookfield Road, Tifton, GA 31794
MLS# 10664772Listed by: eXp Realty $200,000Active3 beds 2 baths1,610 sq. ft.
502 E 20th St, Tifton, GA 31794
MLS# 138817Listed by: ADVANTAGE REALTY PARTNERS LLC $149,900Active4 beds 2 baths1,223 sq. ft.
2066 E Us Hwy 82, Tifton, GA 31794
MLS# 138802Listed by: SOUTHERN CLASSIC REALTORS $384,400Active4 beds 3 baths1,971 sq. ft.
378 Ellen's Walk, Tifton, GA 31794
MLS# 138760Listed by: POPE, THE REAL ESTATE COMPANY $14,000Active0.2 Acres
603 21st Street W, Tifton, GA 31794
MLS# 10704625Listed by: Chapman Hall Realtors Alpharetta- New
 $279,000Active4 beds 3 baths2,037 sq. ft.
2609 Emmett Drive N, Tifton, GA 31794
MLS# 10716258Listed by: Southern Classic Realtors  $225,000Active4 beds 4 baths3,482 sq. ft.
1617 N Wilson Avenue, Tifton, GA 31794
MLS# 138624Listed by: KELLER WILLIAMS GEORGIA COMMUNITIES $130,000Active4 beds 3 baths2,576 sq. ft.
401 Park Ave,n, Tifton, GA 31794
MLS# 145539Listed by: KELLER WILLIAMS REALTY RIVER CITIES $630,000Active92 Acres
0 Belflower Rd, Tifton, GA 31794
MLS# 138547Listed by: KELLER WILLIAMS GEORGIA COMMUNITIES $440,000Active4 beds 3 baths2,248 sq. ft.
346 Somers Ln, Tifton, GA 31794
MLS# 140212Listed by: POPE, THE REAL ESTATE COMPANY $200,000Active5 beds 2 baths2,748 sq. ft.
1003 Davis, Tifton, GA 31794
MLS# 138476Listed by: POPE, THE REAL ESTATE COMPANY $410,300Active4 beds 3 baths2,104 sq. ft.
372 Ellen's Walk, Tifton, GA 31794
MLS# 138463Listed by: POPE, THE REAL ESTATE COMPANY $89,000Active2 beds 1 baths732 sq. ft.
311 W 11th Street, Tifton, GA 31794
MLS# 10531469Listed by: Southern Classic Realtors $192,000Active15 Acres
15 acres Highway 41 N, Tifton, GA 31794
MLS# 138420Listed by: KUNES REAL ESTATE & APPRAISALS $397,660Active33.7 Acres
33.7 ac Highway 41 N, Tifton, GA 31794
MLS# 138421Listed by: KUNES REAL ESTATE & APPRAISALS $545,440Active48.7 Acres
48 acres Us 41 N, Tifton, GA 31794
MLS# 138419Listed by: KUNES REAL ESTATE & APPRAISALS $1,290,000Active5 beds 6 baths5,541 sq. ft.
100 Long Pine Road, Tifton, GA 31794
MLS# 10530159Listed by: Beycome Brokerage Realty LLC $55,900Active1.91 Acres
Lot 222 Forest Lakes Drive, Tifton, GA 31794
MLS# 137506Listed by: COLDWELL BANKER ACTIVE REAL ESTATE $1,275,000Active5 beds 6 baths4,620 sq. ft.
87 Waterfront Street, Tifton, GA 31794
MLS# 138375Listed by: KELLER WILLIAMS GEORGIA COMMUNITIES $145,000Active6 beds 3 baths2,432 sq. ft.
2729 Central Ave, Tifton, GA 31794
MLS# 925393Listed by: LPT REALTY $998,066Active89.46 Acres
0 Brighton Rd, Tifton, GA 31794
MLS# 138240Listed by: POPE, THE REAL ESTATE COMPANY $610,000Active-- beds -- baths
0076 001 Tifton Eldorado Road, Tifton, GA 31793
MLS# 10491191Listed by: Lock and Key Realty $369,900Active3 beds 2 baths2,664 sq. ft.
142 Brighton Road, Tifton, GA 31794
MLS# 138174Listed by: COLDWELL BANKER ACTIVE REAL ESTATE $165,000Active4 beds 3 baths1,920 sq. ft.
416 W 6th St, Tifton, GA 31794
MLS# 138092Listed by: SOUTHERN CLASSIC REALTORS $475,000Active48.44 Acres
4716 Union Road, Tifton, GA 31794
MLS# 138077Listed by: KELLER WILLIAMS GEORGIA COMMUNITIES $645,000Active31.4 Acres
13 Amoco Rd, Tifton, GA 31794
MLS# 138017Listed by: SOUTHERN CLASSIC REALTORS $49,999Active1.15 Acres
0 N Us Hwy 319, Tifton, GA 31794
MLS# 137979Listed by: KUNES REAL ESTATE & APPRAISALS $1,199,000Active4.74 Acres
0 Union Rd, Tifton, GA 31794
MLS# 137902Listed by: ADVANTAGE REALTY PARTNERS LLC $42,500Active0.5 Acres
0 Central Ave, Tifton, GA 31794
MLS# 140231Listed by: POPE, THE REAL ESTATE COMPANY $289,900Active3 beds 3 baths2,012 sq. ft.
2612 Goff, Tifton, GA 31794
MLS# 137844Listed by: SOUTHERN CLASSIC REALTORS $217,800Active22 Acres
340 N Us Hwy 319, Tifton, GA 31794
MLS# 137496Listed by: COLDWELL BANKER ACTIVE REAL ESTATE $2,689,999Active0 Acres
720 Vanceville County Line Rd, Tifton, GA 31794
MLS# 138544Listed by: POPE, THE REAL ESTATE COMPANY $175,000Active2.08 Acres
-0- Old Ocilla Rd, Tifton, GA 31794
MLS# 135748Listed by: CENTURY 21 SMITH BRANCH, LLC. $798,066Active115.72 Acres
0 Baker Rd, Tifton, GA 31794
MLS# 138355Listed by: POPE, THE REAL ESTATE COMPANY $495,000Active29.5 Acres
0 Carpenter Road, Tifton, GA 31794
MLS# 137952Listed by: POPE, THE REAL ESTATE COMPANY $4,469,750Active178.79 Acres
0 S Us Hwy 41 / Lee Ball Rd,, Tifton, GA 31794
MLS# 134993Listed by: ADVANTAGE REALTY PARTNERS LLC $1,547,490Active210.83 Acres
0 E 0 Hwy 125 South, Tifton, GA 31794
MLS# 128546Listed by: ADVANTAGE REALTY PARTNERS LLC $59,900Active0.8 Acres
0 Forest Lake Drive, Tifton, GA 31794
MLS# 134325Listed by: KUNES REAL ESTATE & APPRAISALS $32,900Active1.11 Acres
Tract 1 Highway 319 N, Tifton, GA 31794
MLS# 134338Listed by: KUNES REAL ESTATE & APPRAISALS $32,900Active1.11 Acres
Tract 2 Highway 319 N, Tifton, GA 31794
MLS# 134340Listed by: KUNES REAL ESTATE & APPRAISALS $32,900Active1.11 Acres
Tract 3 Highway 319 N, Tifton, GA 31794
MLS# 134341Listed by: KUNES REAL ESTATE & APPRAISALS $32,900Active1.11 Acres
Tract 4 Harold Tyson Road, Tifton, GA 31794
MLS# 134342Listed by: KUNES REAL ESTATE & APPRAISALS $39,900Active1.59 Acres
Tract 5 Harold Tyson Road, Tifton, GA 31794
MLS# 134343Listed by: KUNES REAL ESTATE & APPRAISALS
Local realty services provided by:CENTURY 21 North East, CENTURY 21 Smith Branch, CENTURY 21 Realty Advisors GA, CENTURY 21 First Story Real Estate, CENTURY 21 Triangle Group, CENTURY 21 Avenues Real Estate Partners, CENTURY 21 The Avenues
2026 Georgia MLS. All rights reserved. Information Deem Reliable But Not Guaranteed March 31, 2026
Popular searches near 31794
Popular neighborhoods near 31794
- Betton Hills, Tallahassee homes for sale
- Betton Woods, Tallahassee homes for sale
- Bucklake, Tallahassee homes for sale
- Bull Run, Tallahassee homes for sale
- Canopy, Tallahassee homes for sale
- Centerville Rural Community, Tallahassee homes for sale
- Chaires, Tallahassee homes for sale
- Grove Pointe, Hahira homes for sale
- Killearn Acres, Tallahassee homes for sale
- Killearn Estates, Tallahassee homes for sale
- Killearn Homes, Tallahassee homes for sale
- Killearn Lakes, Tallahassee homes for sale
- Killearn Lakes Plantation, Tallahassee homes for sale
- Lake McBride Area, Tallahassee homes for sale
- Melody Hills, Tallahassee homes for sale
- Miccosukee Area, Tallahassee homes for sale
- Old Bainbridge Canopy, Tallahassee homes for sale
- Ox Bottom Manor, Tallahassee homes for sale
- Piney Z, Tallahassee homes for sale
- Rawson Park, Albany homes for sale
Counties near Tifton, 31794
- Atkinson County homes for sale
- Ben Hill County homes for sale
- Berrien County homes for sale
- Brooks County homes for sale
- Coffee County homes for sale
- Colquitt County homes for sale
- Cook County homes for sale
- Crisp County homes for sale
- Dougherty County homes for sale
- Irwin County homes for sale
- Lanier County homes for sale
- Lee County homes for sale
- Lowndes County homes for sale
- Mitchell County homes for sale
- Telfair County homes for sale
- Thomas County homes for sale
- Tift County homes for sale
- Turner County homes for sale
- Wilcox County homes for sale
- Worth County homes for sale
Protect your home and budget from life's surprises with an Assurant Home Warranty, backed by a partner that supports you through every step of homeownership. Explore Plans.
©2026 Century 21 Real Estate LLC. All rights reserved. CENTURY 21®, the CENTURY 21 Logo and C21® are service marks owned by Century 21 Real Estate LLC. Century 21 Real Estate LLC fully supports the principles of the Fair Housing Act and the Equal Opportunity Act. Each office is independently owned and operated. Listing information is deemed reliable but not guaranteed accurate.