- Alger Heights, Grand Rapids homes for sale
- Baxter, Grand Rapids homes for sale
- Eastern, Grand Rapids homes for sale
- Fuller Avenue, Grand Rapids homes for sale
- Garfield Park, Grand Rapids homes for sale
- Grandville, Grand Rapids homes for sale
- Heartside, Grand Rapids homes for sale
- Heritage Hill, Grand Rapids homes for sale
- John Ball Park, Grand Rapids homes for sale
- Ken - O - Sha Park, Grand Rapids homes for sale
- Madison Area, Grand Rapids homes for sale
- Millbrook, Grand Rapids homes for sale
- Oakdale, Grand Rapids homes for sale
- Ridgemoor, Grand Rapids homes for sale
- Roosevelt Park, Grand Rapids homes for sale
- Shangrai - La, Grand Rapids homes for sale
- Shawnee Park, Grand Rapids homes for sale
- South Hill, Grand Rapids homes for sale
- Southeast Community, Grand Rapids homes for sale
- Southeast End, Grand Rapids homes for sale
Wyoming, MI - homes for sale
192 of 192 results displayed
- New
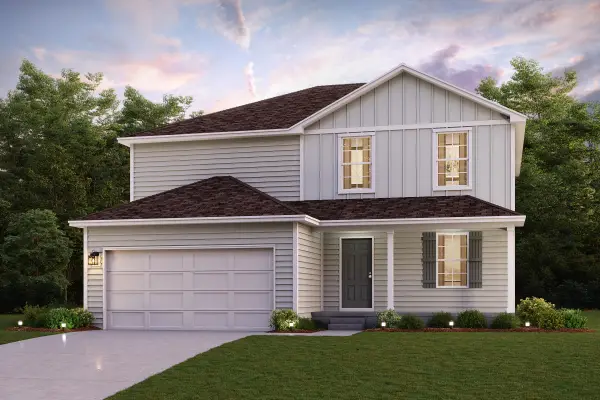 $431,990Active4 beds 3 baths2,014 sq. ft.
5731 Hemlock Drive SW, Wyoming, MI 49418
MLS# 64026036539Listed by: WJH BROKERAGE MI, LLC
- New
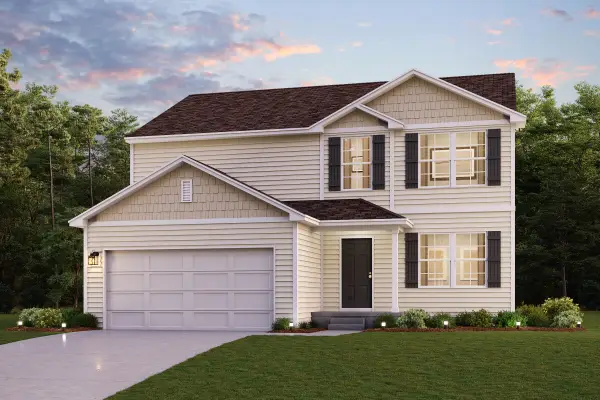 $427,990Active4 beds 3 baths2,014 sq. ft.
5747 Hemlock Drive SW, Wyoming, MI 49418
MLS# 64026036547Listed by: WJH BROKERAGE MI, LLC - New
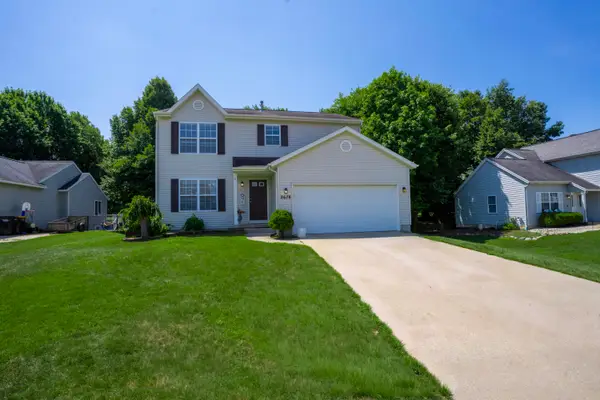
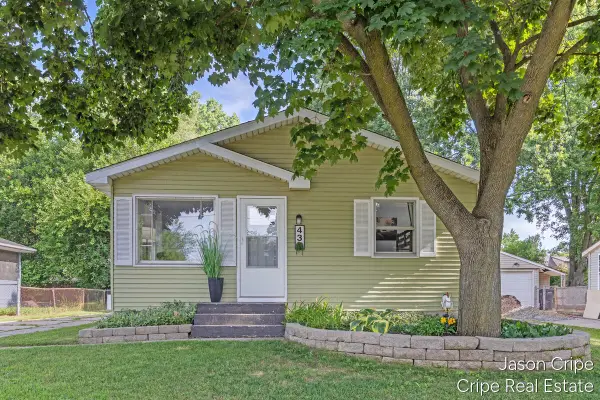 $289,900Active3 beds 2 baths1,796 sq. ft.
43 35th Street Se, Wyoming, MI 49548
MLS# 26036469Listed by: COLDWELL BANKER SCHMIDT REALTORS - New
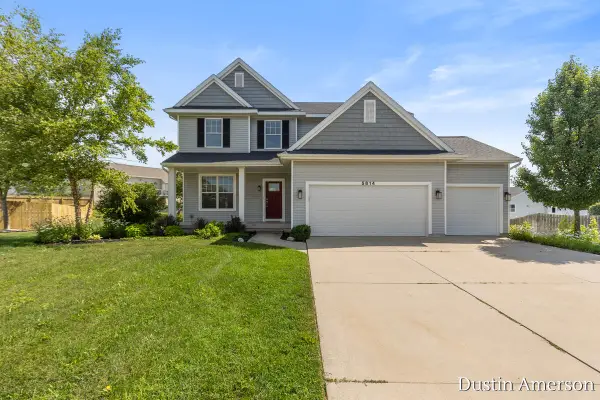 $479,900Active6 beds 4 baths3,046 sq. ft.
5814 Sage River Court SW, Wyoming, MI 49418
MLS# 65026036398Listed by: CITY2SHORE REAL ESTATE FOUNDATIONS - New
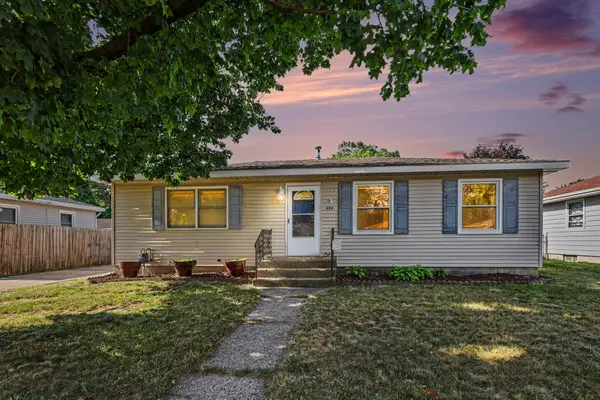
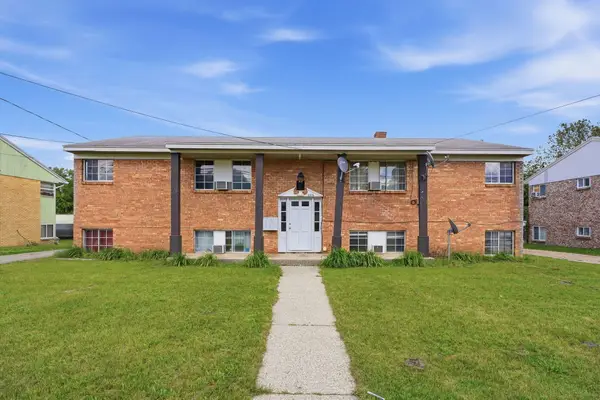
 $310,000Active4 beds 2 baths901 sq. ft.
2110 Floyd, Wyoming, MI 49519
MLS# 70546019Listed by: CODY AND CO. - New
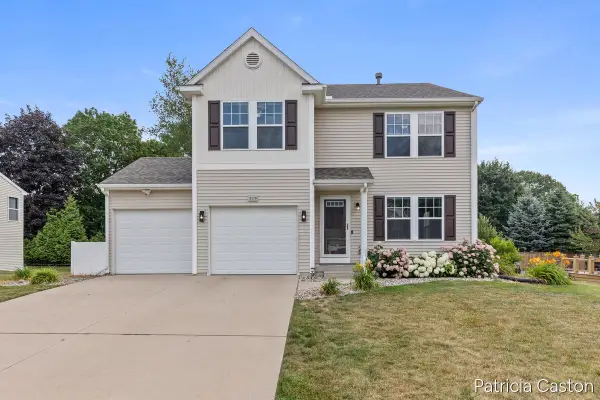
 $424,000Active4 beds 3 baths1,836 sq. ft.
2516 Golfbury, Wyoming, MI 49519
MLS# 70546060Listed by: COLDWELL BANKER SCHMIDT REALTORS - New
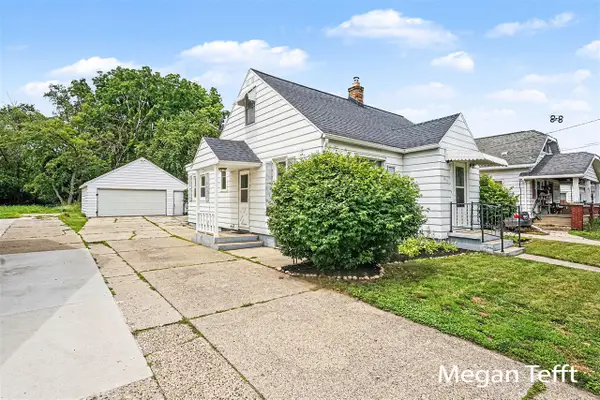
 $249,900Active4 beds 2 baths1,564 sq. ft.
1620 Burlingame Avenue SW, Wyoming, MI 49509
MLS# 65026036358Listed by: RE/MAX SUNQUEST REALTY - New
 $339,900Active5 beds 3 baths1,588 sq. ft.
3551 Parkland Avenue SW, Wyoming, MI 49509
MLS# 65026036257Listed by: EMBER AND STONE REAL ESTATE - New
 $379,900Active5 beds 3 baths2,450 sq. ft.
1521 Woodhill Court SW, Wyoming, MI 49509
MLS# 65026036247Listed by: FIVE STAR REAL ESTATE (COURTLAND) - New
 $699,000Active5 beds 5 baths2,379 sq. ft.
4256 Del Mar, Grandville, MI 49418
MLS# 70545669Listed by: KELLER WILLIAMS REALTY RIVERTOWN - Open Sat, 12 to 2pmNew
 $630,000Active4 beds 3 baths3,082 sq. ft.
5982 Canal Avenue SW, Grandville, MI 49418
MLS# 65026036117Listed by: KELLER WILLIAMS REALTY RIVERTOWN - New
 $209,900Active2 beds 1 baths957 sq. ft.
818 Bryant, Wyoming, MI 49509
MLS# 70545675Listed by: EXP REALTY (GRAND RAPIDS) - New
 $630,000Active4 beds 3 baths1,801 sq. ft.
5982 Canal, Grandville, MI 49418
MLS# 70545779Listed by: KELLER WILLIAMS REALTY RIVERTOWN - Open Sat, 12 to 2pmNew
 $699,000Active5 beds 5 baths3,579 sq. ft.
4256 Del Mar Drive SW, Grandville, MI 49418
MLS# 65026035994Listed by: KELLER WILLIAMS REALTY RIVERTOWN - New
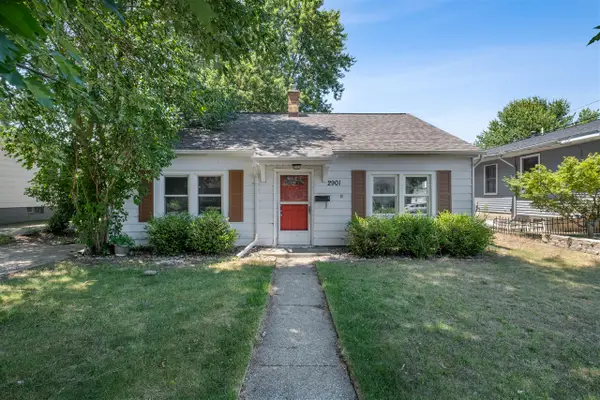 $199,900Active2 beds 1 baths960 sq. ft.
2901 Union, Wyoming, MI 49548
MLS# 70545605Listed by: HOMES AND LOANS OF W MICH - New
 $254,900Active2 beds 1 baths1,008 sq. ft.
2561 Taft, Wyoming, MI 49519
MLS# 70545547Listed by: HOMEREALTY HOLLAND - Open Sun, 12 to 2pmNew
 $229,000Active2 beds 1 baths864 sq. ft.
885 Barnum Street Sw, Wyoming, MI 49509
MLS# 26035878Listed by: BELLABAY REALTY LLC - New
 $270,000Active2 beds 1 baths1,715 sq. ft.
650 Oakcrest Street Sw, Wyoming, MI 49509
MLS# 26035809Listed by: FIVE STAR REAL ESTATE (GRANDV) - New
 $445,000Active3 beds 4 baths1,712 sq. ft.
2678 Cotherstone Drive Sw, Wyoming, MI 49418
MLS# 26035688Listed by: EXP REALTY LLC - New
 $499,900Active-- beds -- baths
2916 Taft Avenue Sw, Wyoming, MI 49519
MLS# 26035567Listed by: EPIQUE REALTY - New
 $309,000Active4 beds 2 baths1,189 sq. ft.
1955 Blandford, Wyoming, MI 49519
MLS# 70545195Listed by: FIVE STAR REAL ESTATE (ADA) - New
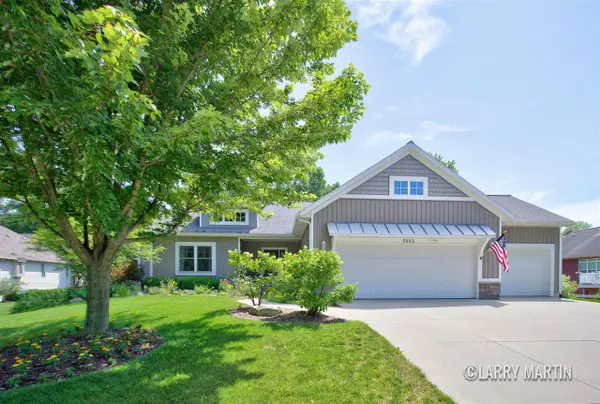
 $469,900Active4 beds 3 baths2,016 sq. ft.
5170 Red River, Wyoming, MI 49418
MLS# 70545093Listed by: BERKSHIRE HATHAWAY HOMESERVICES MICHIGAN REAL ESTATE (CASCADE) - Open Sat, 11am to 1pmNew
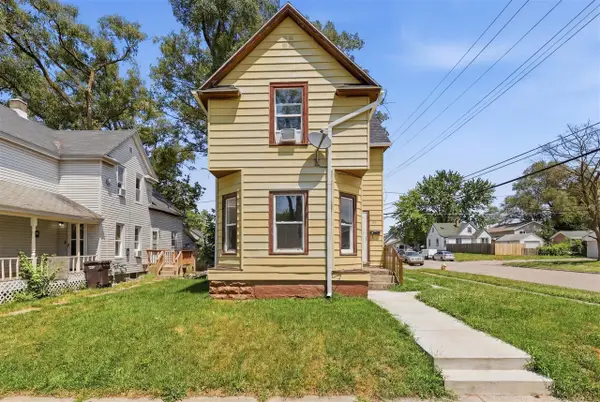
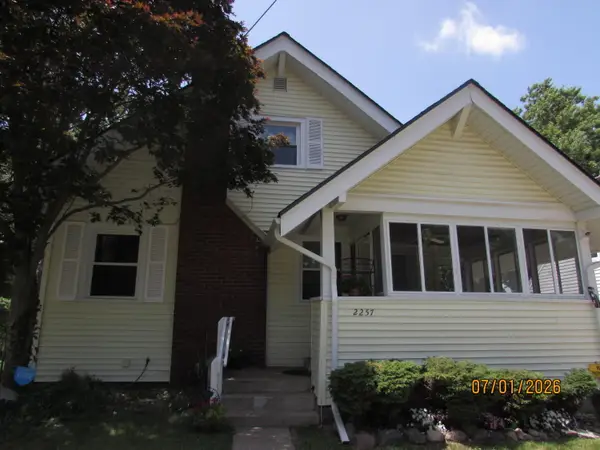 $289,000Active4 beds 1 baths1,728 sq. ft.
2257 Wyoming Avenue Sw, Wyoming, MI 49519
MLS# 26033815Listed by: KEY REALTY - New
 $184,900Active2 beds 1 baths624 sq. ft.
2617 Clyde Park, Wyoming, MI 49509
MLS# 70545016Listed by: KHOURY REAL ESTATE - New
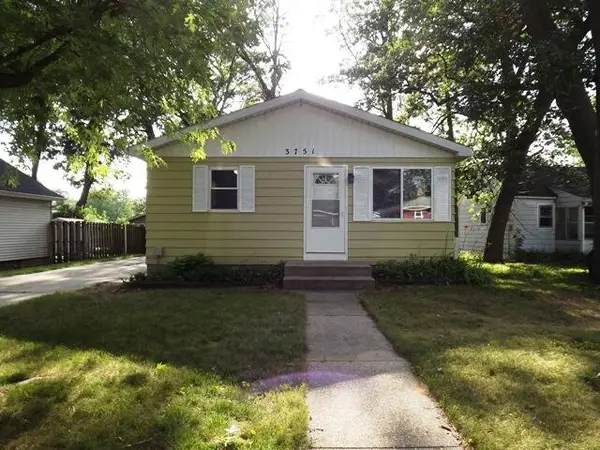
 $274,900Active3 beds 2 baths864 sq. ft.
3751 Michael, Wyoming, MI 49509
MLS# 70544959Listed by: RE/MAX OF GRAND RAPIDS (FH) - New
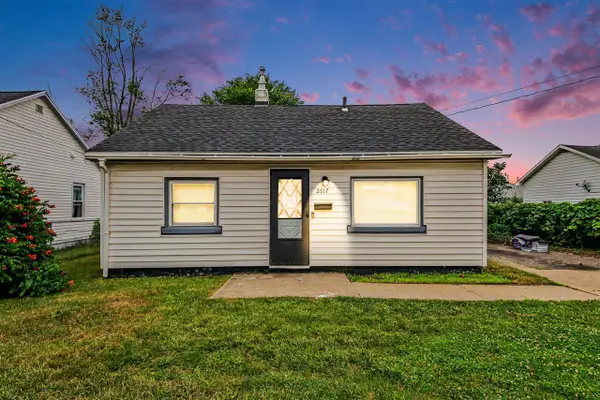
 $274,900Active3 beds 2 baths964 sq. ft.
3751 Michael Avenue Sw, Wyoming, MI 49509
MLS# 26035290Listed by: RE/MAX OF GRAND RAPIDS (FH) 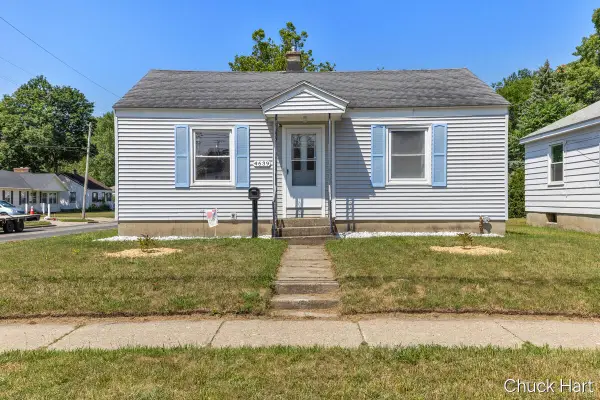 $234,900Pending2 beds 1 baths984 sq. ft.
4639 Walton Avenue Sw, Grand Rapids, MI 49548
MLS# 26035171Listed by: COLDWELL BANKER SCHMIDT REALTORS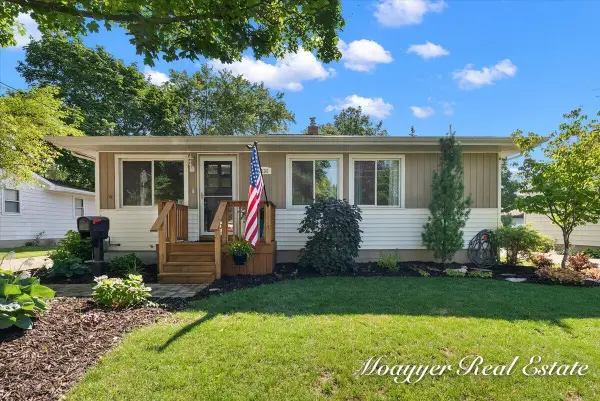 $299,000Pending3 beds 2 baths1,850 sq. ft.
4136 Oriole Avenue SW, Wyoming, MI 49509
MLS# 65026034343Listed by: MOAYYER REAL ESTATE- New
 $329,900Active3 beds 2 baths2,300 sq. ft.
1531 32nd Street SW, Wyoming, MI 49509
MLS# 65026034470Listed by: KELLER WILLIAMS REALTY RIVERTOWN - Open Sun, 1 to 3pmNew
 $364,900Active3 beds 2 baths1,546 sq. ft.
2401 Lamar Avenue SW, Wyoming, MI 49519
MLS# 65026034488Listed by: EXP REALTY LLC  $315,000Pending3 beds 2 baths1,906 sq. ft.
1533 Royal Oak Street SW, Wyoming, MI 49509
MLS# 65026034768Listed by: HOMESTEAD REALTY OF W MICHIGAN $224,500Pending2 beds 2 baths1,332 sq. ft.
3487 Stonevalley Lane SW, Wyoming, MI 49519
MLS# 65026035052Listed by: BELLABAY REALTY (KENTWOOD) $439,000Pending2 beds 3 baths2,167 sq. ft.
5060 Tanana River Avenue SW Building: -, Wyoming, MI 49418
MLS# 65026034359Listed by: DEVOS REALTY LLC- New
 $269,900Active3 beds 1 baths888 sq. ft.
241 50th Street Sw, Grand Rapids, MI 49548
MLS# 26035030Listed by: FORD REAL ESTATE OF MICH LLC  $285,000Pending3 beds 2 baths1,040 sq. ft.
3458 Collingwood, Wyoming, MI 49519
MLS# 70544445Listed by: FIVE STAR REAL ESTATE (GRANDV) $300,000Pending3 beds 3 baths1,704 sq. ft.
2626 Forest Grove, Wyoming, MI 49519
MLS# 70544538Listed by: BELLABAY REALTY (SW)- New
 $269,900Active3 beds 2 baths941 sq. ft.
246 Maplelawn Street Sw, Wyoming, MI 49548
MLS# 26034597Listed by: LAKE MICHIGAN REALTY MGMT - New
 $279,900Active-- beds -- baths
1201 Rathbone, Wyoming, MI 49509
MLS# 70544320Listed by: FIVE STAR REAL ESTATE (MAIN) 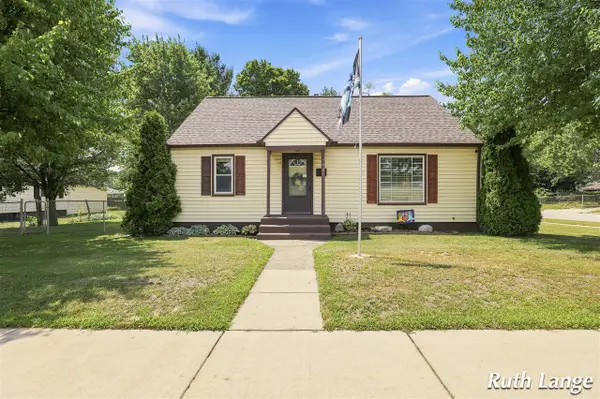 $264,900Pending3 beds 1 baths1,410 sq. ft.
3401 Clyde Park, Wyoming, MI 49509
MLS# 70544300Listed by: FIVE STAR REAL ESTATE (COURTLAND)- New
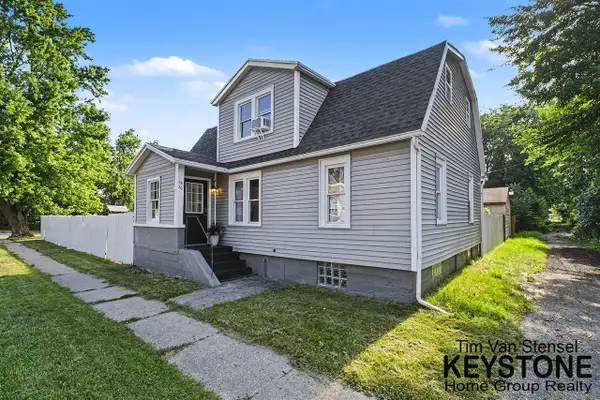 $269,900Active3 beds 1 baths1,152 sq. ft.
1510 Judd, Wyoming, MI 49509
MLS# 70544183Listed by: KEYSTONE HOME GROUP REALTY LLC - New
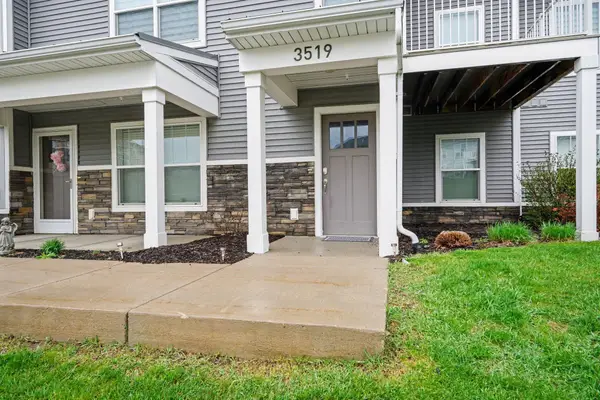 $299,900Active2 beds 2 baths1,471 sq. ft.
3519 Crystal River Street Sw, Wyoming, MI 49418
MLS# 26034356Listed by: DEVOS REALTY LLC - New
 $244,900Active3 beds 2 baths1,404 sq. ft.
4870 Ausable River Drive Sw, Wyoming, MI 49418
MLS# 26034386Listed by: DEVOS REALTY LLC - New
 $599,900Active-- beds -- baths
3131 Copley Drive Sw, Wyoming, MI 49509
MLS# 26034155Listed by: WINDPOINT REALTY LLC - New
 $59,900Active1 beds 1 baths585 sq. ft.
2130 Banner Drive Sw #21, Wyoming, MI 49509
MLS# 26034258Listed by: LAKE MICHIGAN REALTY MGMT  $279,000Pending3 beds 2 baths864 sq. ft.
3924 Heron, Wyoming, MI 49509
MLS# 70543939Listed by: CITY2SHORE GATEWAY GROUP $215,000Pending2 beds 1 baths950 sq. ft.
3441 Buchanan Avenue SW, Wyoming, MI 49548
MLS# 65026034171Listed by: INDEPENDENCE REALTY (MAIN)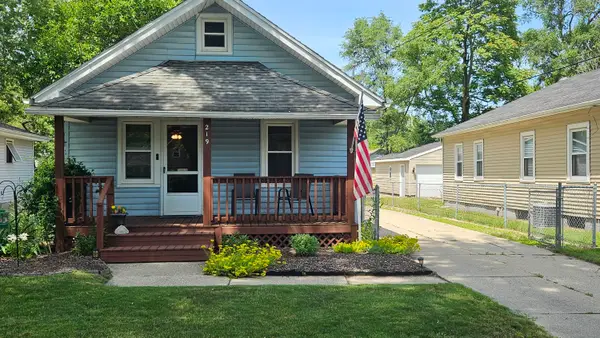 $209,900Pending1 beds 1 baths850 sq. ft.
219 Abbie Street SE, GrandRapids, MI 49548
MLS# 65026034077Listed by: CHARTER PROPERTIES- New
 $224,900Active2 beds 1 baths750 sq. ft.
3445 Reiser, Grand Rapids, MI 49548
MLS# 70543740Listed by: THE LOCAL ELEMENT  $325,000Pending3 beds 3 baths1,768 sq. ft.
4811 Denali River #11, Grandville, MI 49418
MLS# 70543699Listed by: BELLABAY REALTY (SW)- Open Sat, 12:30 to 2pmNew
 $275,000Active3 beds 1 baths1,106 sq. ft.
4250 Illinois Avenue Sw, Wyoming, MI 49509
MLS# 26033989Listed by: KELLER WILLIAMS GR NORTH  $325,000Pending3 beds 3 baths1,768 sq. ft.
4811 Denali River Avenue SW Building: H-13 Unit: 11, Grandville, MI 49418
MLS# 65026034024Listed by: BELLABAY REALTY (SW) $299,000Pending-- beds -- baths
1330-1332 36th Street SW, Wyoming, MI 49509
MLS# 65026033958Listed by: 616 REALTY LLC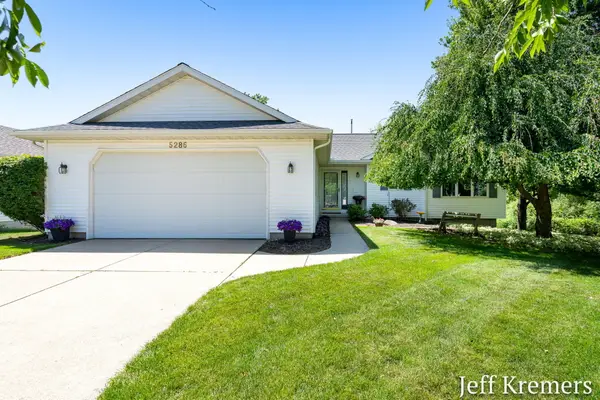 $439,000Pending4 beds 4 baths2,041 sq. ft.
5286 Debbie Court SW, Grandville, MI 49418
MLS# 65026033867Listed by: WEST MICHIGAN REALTY PROS $439,000Pending4 beds 4 baths1,280 sq. ft.
5286 Debbie, Grandville, MI 49418
MLS# 70543547Listed by: WEST MICHIGAN REALTY PROS $469,900Pending5 beds 3 baths2,454 sq. ft.
1878 Glenvale, Wyoming, MI 49519
MLS# 70543302Listed by: THE LOCAL ELEMENT $299,900Active3 beds 2 baths936 sq. ft.
2530 De Hoop, Wyoming, MI 49509
MLS# 70543073Listed by: APEX REALTY GROUP $299,900Pending3 beds 2 baths1,529 sq. ft.
1552 41st Street SW, Wyoming, MI 49509
MLS# 65026033107Listed by: FIVE STAR REAL ESTATE (EASTOWN) $299,900Pending3 beds 2 baths1,008 sq. ft.
1712 41st, Wyoming, MI 49519
MLS# 70542690Listed by: FIVE STAR REAL ESTATE-HOLLAND $295,000Pending3 beds 2 baths957 sq. ft.
1450 Blanchard, Wyoming, MI 49509
MLS# 70542533Listed by: FIVE STAR REAL ESTATE (M6)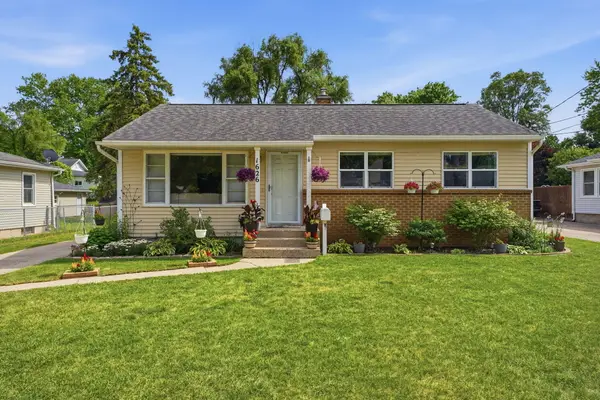 $310,000Pending3 beds 1 baths1,162 sq. ft.
1626 Royal Oak Street SW, Wyoming, MI 49519
MLS# 65026032789Listed by: EPIQUE REALTY $537,500Active-- beds -- baths
1860 Prairie Parkway Sw, Wyoming, MI 49519
MLS# 26032644Listed by: MOXIE REAL ESTATE + DEVELOPMENT $220,000Pending2 beds 1 baths816 sq. ft.
3746 Raven, Wyoming, MI 49509
MLS# 70542316Listed by: FIVE STAR REAL ESTATE (ADA) $289,999Active2 beds 2 baths821 sq. ft.
650 Marcia Street Sw, Wyoming, MI 49509
MLS# 26032555Listed by: FIVE STAR REAL ESTATE (COURTLAND) $250,000Pending3 beds 1 baths1,600 sq. ft.
3021 Jefferson Avenue SE, GrandRapids, MI 49548
MLS# 65026032531Listed by: GREAT LAKES REALTY $420,000Active4 beds 3 baths2,046 sq. ft.
5143 Wembley, Wyoming, MI 49509
MLS# 70541981Listed by: CITY2SHORE GATEWAY GROUP $314,900Active3 beds 2 baths1,531 sq. ft.
2317 Collingwood, Wyoming, MI 49519
MLS# 70541943Listed by: CITY2SHORE REAL ESTATE INC. $439,900Pending5 beds 3 baths1,347 sq. ft.
2896 Barcroft, Wyoming, MI 49418
MLS# 70541766Listed by: FIVE STAR REAL ESTATE (GRANDV) $264,900Pending3 beds 1 baths1,504 sq. ft.
1930 Galewood Avenue SW, Wyoming, MI 49509
MLS# 65026032186Listed by: BERKSHIRE HATHAWAY HOMESERVICES MICHIGAN REAL ESTATE (MAIN) $495,000Pending4 beds 3 baths2,380 sq. ft.
5713 Kenstyn, Wyoming, MI 49418
MLS# 70541732Listed by: FULL CIRCLE REALTY $413,990Pending4 beds 3 baths2,014 sq. ft.
5744 Hemlock Drive SW, Wyoming, MI 49418
MLS# 64026031930Listed by: WJH BROKERAGE MI, LLC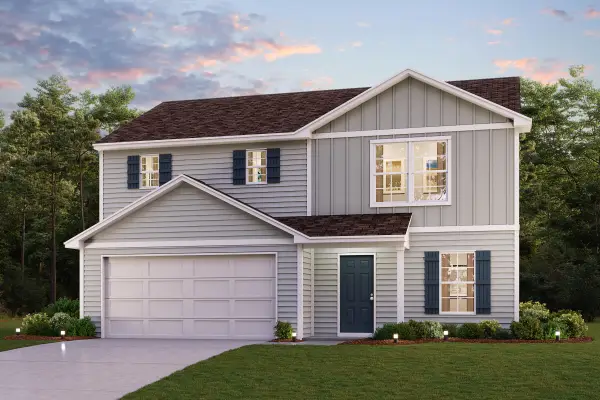 $401,990Pending4 beds 3 baths1,824 sq. ft.
5732 Hemlock Drive SW Unit: SW, Grandville, MI 49418
MLS# 64026031943Listed by: WJH BROKERAGE MI, LLC $414,990Pending4 beds 3 baths2,014 sq. ft.
5726 Hemlock Drive SW, Wyoming, MI 49418
MLS# 64026031951Listed by: WJH BROKERAGE MI, LLC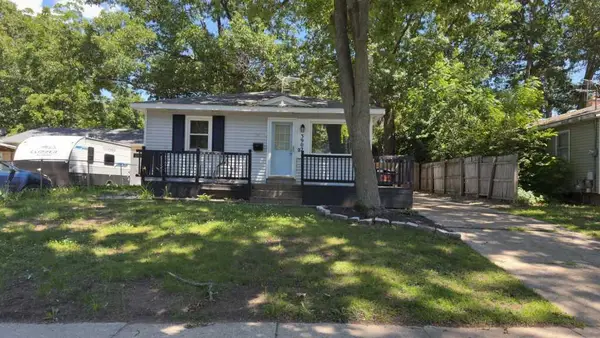 $259,900Pending3 beds 1 baths950 sq. ft.
3902 Oriole Avenue SW, Wyoming, MI 49509
MLS# 71026031914Listed by: KERMATH REALTY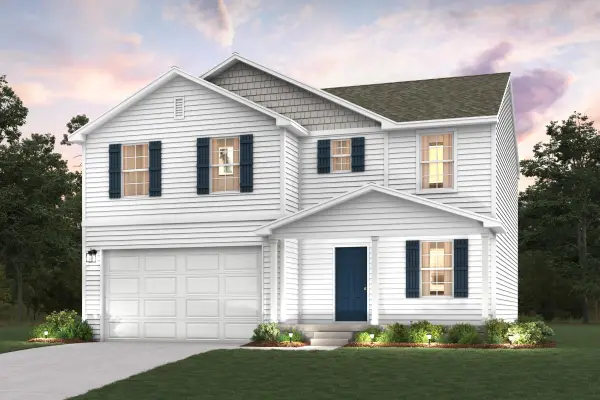 $420,990Active4 beds 3 baths2,014 sq. ft.
5739 Hemlock Drive Sw, Wyoming, MI 49418
MLS# 26031952Listed by: WJH BROKERAGE MI, LLC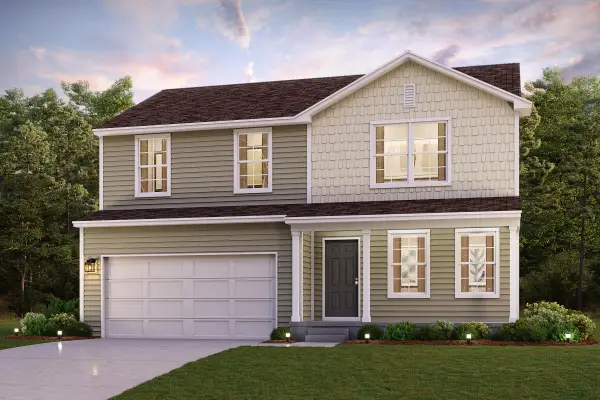 $399,990Active4 beds 3 baths1,824 sq. ft.
5755 Hemlock Drive Sw #SW, Grandville, MI 49418
MLS# 26031968Listed by: WJH BROKERAGE MI, LLC $417,990Active4 beds 3 baths2,014 sq. ft.
5789 Hemlock Drive Sw, Wyoming, MI 49418
MLS# 26031972Listed by: WJH BROKERAGE MI, LLC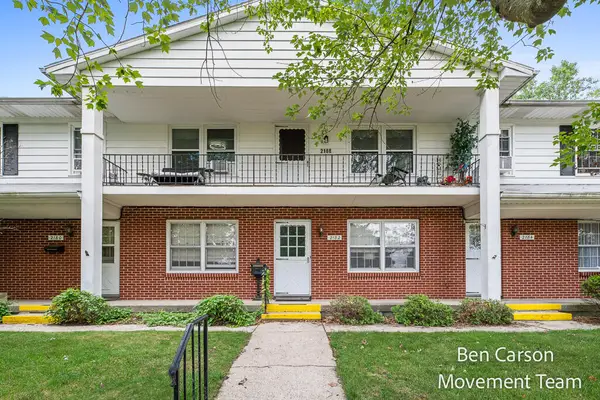 $75,000Active2 beds 1 baths740 sq. ft.
2188 Banner Drive Sw, Wyoming, MI 49509
MLS# 26031949Listed by: RE/MAX LAKESHORE- Open Sat, 2:30 to 4pm
 $295,000Active4 beds 2 baths1,885 sq. ft.
3844 Clyde Park Avenue Sw, Wyoming, MI 49509
MLS# 26031870Listed by: RE/MAX UNITED (BELTLINE)  $205,000Active2 beds 1 baths868 sq. ft.
1829 Delwood Avenue Sw, Wyoming, MI 49509
MLS# 26031871Listed by: BERKSHIRE HATHAWAY HOMESERVICES MICHIGAN REAL ESTATE (SOUTH) $289,900Pending3 beds 2 baths1,708 sq. ft.
1281 Blanchard Street SW, Wyoming, MI 49509
MLS# 65026031725Listed by: RE/MAX OF GRAND RAPIDS (STNDL) $249,900Pending3 beds 1 baths1,104 sq. ft.
4914 Haughey, Wyoming, MI 49548
MLS# 70541402Listed by: RE/MAX OF GRAND RAPIDS (GRANDVILLE) $240,000Pending3 beds 2 baths1,214 sq. ft.
3015 Buchanan Avenue SW, GrandRapids, MI 49548
MLS# 65026031656Listed by: FIVE STAR REAL ESTATE (ADA) $363,577Active3 beds 3 baths1,852 sq. ft.
4886 Hidden River Avenue Sw #60, Wyoming, MI 49418
MLS# 26031391Listed by: DEVOS REALTY LLC $359,276Active3 beds 3 baths1,862 sq. ft.
4894 Hidden River Avenue Sw #62, Wyoming, MI 49418
MLS# 26031394Listed by: DEVOS REALTY LLC $414,900Pending3 beds 2 baths1,156 sq. ft.
5338 Quest, Grandville, MI 49418
MLS# 70541054Listed by: APEX REALTY GROUP $414,900Pending3 beds 2 baths2,152 sq. ft.
5338 Quest Drive SW, Grandville, MI 49418
MLS# 65026031368Listed by: APEX REALTY GROUP $279,000Pending3 beds 2 baths960 sq. ft.
3815 Perry, Wyoming, MI 49519
MLS# 70540875Listed by: LANDMARK REAL ESTATE GROUP- Open Sat, 12 to 2pm
 $459,900Active3 beds 4 baths2,464 sq. ft.
5892 Powderhorn Court Sw, Wyoming, MI 49418
MLS# 26031150Listed by: CITY2SHORE GATEWAY GROUP OF BYRON CENTER  $379,900Active3 beds 3 baths2,265 sq. ft.
2467 43rd Street Sw, Wyoming, MI 49519
MLS# 26031152Listed by: BERKSHIRE HATHAWAY HOMESERVICES MI
 $265,000Pending2 beds 1 baths1,006 sq. ft.
3810 Clyde Park Avenue Sw, Wyoming, MI 49509
MLS# 26031166Listed by: CENTURY 21 AFFILIATED (GR) $279,900Pending4 beds 2 baths1,960 sq. ft.
3425 McKee Avenue SW, Wyoming, MI 49509
MLS# 65026030782Listed by: FIVE STAR REAL ESTATE (GRANDV) $269,000Pending3 beds 2 baths988 sq. ft.
3547 Collingwood Avenue SW, Wyoming, MI 49519
MLS# 65026030718Listed by: CITY2SHORE REAL ESTATE (GR) $299,900Active3 beds 2 baths1,346 sq. ft.
310 Bellevue, Wyoming, MI 49548
MLS# 70540205Listed by: 616 REALTY LLC $570,000Pending4 beds 4 baths3,770 sq. ft.
4463 Grand Ridge Drive SW, Wyoming, MI 49418
MLS# 65026030293Listed by: EXP REALTY (GRAND RAPIDS) $570,000Pending4 beds 4 baths2,520 sq. ft.
4463 Grand Ridge, Wyoming, MI 49418
MLS# 70539981Listed by: EXP REALTY (GRAND RAPIDS) $299,900Active3 beds 2 baths1,346 sq. ft.
310 Bellevue Street Se, Wyoming, MI 49548
MLS# 26030520Listed by: 616 REALTY LLC $309,900Active4 beds 2 baths914 sq. ft.
319 Holly, Wyoming, MI 49548
MLS# 70539867Listed by: GREENRIDGE REALTY (SUMMIT) $239,000Pending3 beds 1 baths886 sq. ft.
137 Holly Street SW, GrandRapids, MI 49548
MLS# 65026030240Listed by: GRAND RIVER REALTY $285,000Pending3 beds 2 baths2,074 sq. ft.
2433 Wyoming Avenue SW, Wyoming, MI 49519
MLS# 65026030139Listed by: FIVE STAR REAL ESTATE (GRANDV)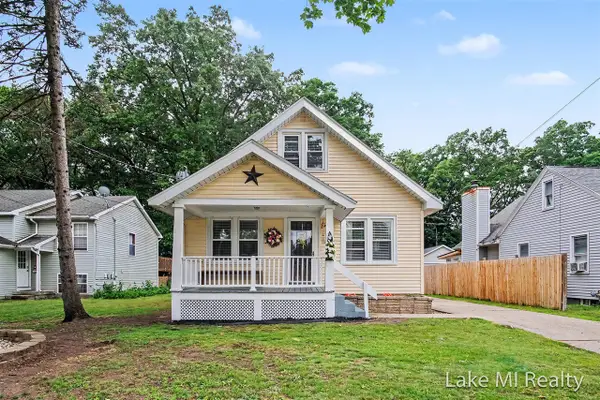 $285,000Pending3 beds 1 baths1,071 sq. ft.
3639 Burlingame, Wyoming, MI 49509
MLS# 70539651Listed by: LAKE MICHIGAN REALTY MGMT $310,000Pending4 beds 2 baths1,758 sq. ft.
4401 Edgemont Drive SW, Wyoming, MI 49519
MLS# 65026029845Listed by: BELLABAY REALTY LLC $325,000Pending3 beds 2 baths2,054 sq. ft.
2235 Roys, Wyoming, MI 49519
MLS# 70539408Listed by: CITY2SHORE REAL ESTATE INC. $485,000Active2 beds 2 baths1,484 sq. ft.
5501 Canal Avenue SW Building: * Unit: 60, Grandville, MI 49418
MLS# 65026029687Listed by: KENSINGTON REALTY GROUP INC. $287,500Pending2 beds 2 baths1,200 sq. ft.
3511 Hubal, Wyoming, MI 49519
MLS# 70539285Listed by: NOVOSAD REALTY PARTNERS $379,999Pending3 beds 4 baths1,899 sq. ft.
4960 Havana, Wyoming, MI 49509
MLS# 70539098Listed by: FIVE STAR REAL ESTATE (COURTLAND) $224,900Pending2 beds 1 baths1,020 sq. ft.
923 Colrain Street SW, Wyoming, MI 49509
MLS# 65026029229Listed by: ASCENT REAL ESTATE GROUP $240,000Pending2 beds 1 baths717 sq. ft.
2473 Longstreet Avenue SW, Wyoming, MI 49509
MLS# 65026029019Listed by: BELLABAY REALTY LLC $224,900Pending3 beds 2 baths720 sq. ft.
3241 Buchanan Avenue SW, GrandRapids, MI 49548
MLS# 65026028998Listed by: KEY REALTY $275,000Pending3 beds 2 baths1,076 sq. ft.
4353 Idlewood, Wyoming, MI 49519
MLS# 70538470Listed by: GREENRIDGE REALTY (EGR) $354,000Active3 beds 3 baths1,730 sq. ft.
3383 Kings River #4, Wyoming, MI 49418
MLS# 70538478Listed by: FIVE STAR REAL ESTATE (EASTOWN) $275,000Active2 beds 3 baths1,708 sq. ft.
3401 Kings River, Grandville, MI 49418
MLS# 70538505Listed by: KELLER WILLIAMS GR NORTH $199,900Pending2 beds 1 baths876 sq. ft.
3710 Oriole Avenue SW, Wyoming, MI 49509
MLS# 65026028793Listed by: FIVE STAR REAL ESTATE (GRANDV) $354,000Active3 beds 3 baths1,730 sq. ft.
3383 Kings River Street SW Building: H-1 Unit: 4, Wyoming, MI 49418
MLS# 65026028794Listed by: FIVE STAR REAL ESTATE (EASTOWN) $214,900Pending2 beds 1 baths1,008 sq. ft.
3955 Madison, Grand Rapids, MI 49548
MLS# 70538234Listed by: HOMEREALTY HOLLAND $240,000Pending3 beds 1 baths1,260 sq. ft.
1225 Rathbone, Wyoming, MI 49509
MLS# 70538298Listed by: FIVE STAR REAL ESTATE (MAIN) $229,900Pending3 beds 2 baths1,092 sq. ft.
2453 Byron Center, Wyoming, MI 49519
MLS# 70538210Listed by: CITY2SHORE REAL ESTATE FOUNDATIONS $299,900Pending3 beds 2 baths875 sq. ft.
1620 32nd, Wyoming, MI 49519
MLS# 70538220Listed by: EXP REALTY LLC $350,000Pending4 beds 3 baths1,074 sq. ft.
1127 Mulligan, Wyoming, MI 49509
MLS# 70538145Listed by: FIVE STAR REAL ESTATE (MAIN) $290,000Pending3 beds 2 baths1,500 sq. ft.
425 Van Allen Street SE, GrandRapids, MI 49548
MLS# 65026028283Listed by: RE/MAX UNITED (MAIN) $219,900Pending2 beds 1 baths720 sq. ft.
248 Himes, Wyoming, MI 49548
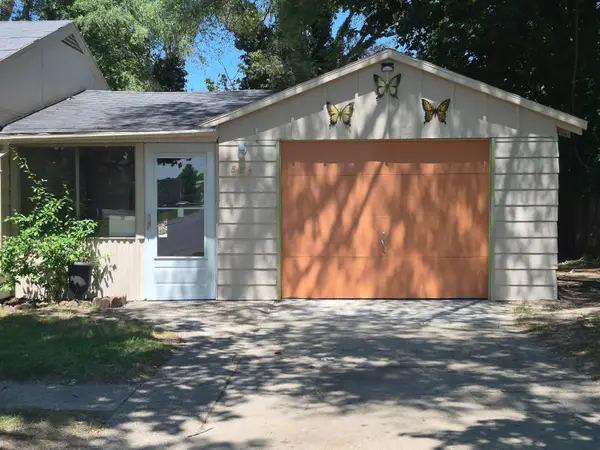
MLS# 70537864Listed by: FIVE STAR REAL ESTATE (MAIN) $200,000Pending3 beds 1 baths932 sq. ft.
2909 Union, Grand Rapids, MI 49548
MLS# 70537665Listed by: KEY REALTY $272,000Pending4 beds 2 baths1,568 sq. ft.
1141 Rathbone Street SW, Wyoming, MI 49509
MLS# 65026028092Listed by: KELLER WILLIAMS REALTY RIVERTOWN $329,900Pending4 beds 2 baths1,685 sq. ft.
860 40th Street SW, Wyoming, MI 49509
MLS# 65026027970Listed by: KEY REALTY $54,900Active2 beds 2 baths1,050 sq. ft.
2658 Kitchener Street SW Unit: 391, Wyoming, MI 49519
MLS# 65026018046Listed by: CONTINENTAL REALTY OF WEST MICHIGAN BY MARIA SAUCEDO $315,000Pending3 beds 3 baths1,724 sq. ft.
822 Aldon Street SW, Wyoming, MI 49509
MLS# 71026029577Listed by: WEST EDGE REAL ESTATE LLC $199,900Pending2 beds 1 baths768 sq. ft.
2841 Longstreet Avenue SW, Wyoming, MI 49509
MLS# 65026027544Listed by: ASCENT REAL ESTATE GROUP $289,900Pending4 beds 3 baths2,000 sq. ft.
301 Lemyra Street SE, Wyoming, MI 49548
MLS# 65026027551Listed by: KELLER WILLIAMS GR NORTH $439,900Active4 beds 3 baths2,240 sq. ft.
1781 Pinnacle Drive Sw, Wyoming, MI 49519
MLS# 26027547Listed by: WINDPOINT REALTY LLC $255,000Pending3 beds 2 baths1,866 sq. ft.
231 50th, Wyoming, MI 49548
MLS# 70527738Listed by: BELLABAY REALTY LLC $299,900Pending4 beds 2 baths1,940 sq. ft.
3414 Perry Avenue SW, Wyoming, MI 49519
MLS# 65026027273Listed by: PRO REAL ESTATE SERVICES LLC $305,000Pending4 beds 2 baths1,440 sq. ft.
238-240 Wilbur Street SE, GrandRapids, MI 49548
MLS# 66026027210Listed by: LISTON & LISTON, LLC DBA LISTON BOSCH REALTY $339,900Active3 beds 2 baths1,770 sq. ft.
2246 Holliday Drive SW, Wyoming, MI 49519
MLS# 65026027009Listed by: JH REALTY PARTNERS $239,000Pending4 beds 1 baths1,477 sq. ft.
1813 Blandford Avenue SW, Wyoming, MI 49519
MLS# 65026027041Listed by: BENCHMARK CAPITAL REALTY $249,900Active3 beds 1 baths1,018 sq. ft.
2645 Longstreet Avenue Sw, Wyoming, MI 49509
MLS# 26026971Listed by: FIVE STAR REAL ESTATE (M6)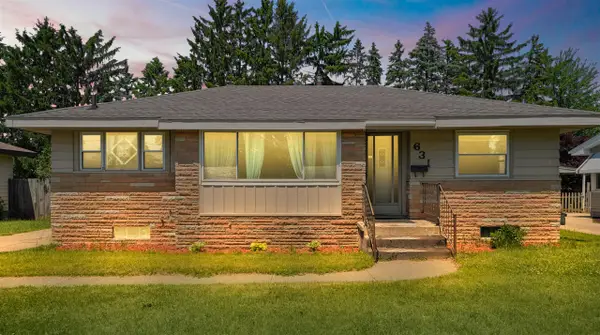 $265,000Pending2 beds 1 baths1,012 sq. ft.
631 Oakcrest, Wyoming, MI 49509
MLS# 70536269Listed by: REDFIN CORPORATION $439,900Active3 beds 3 baths1,814 sq. ft.
5131 Windybrook, Grandville, MI 49418
MLS# 70535845Listed by: HOMESTEAD REALTY OF W MICHIGAN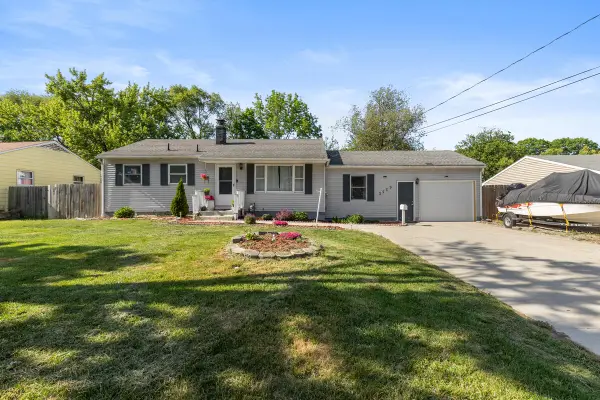 $325,000Active4 beds 2 baths1,454 sq. ft.
2469 Eden, Wyoming, MI 49519
MLS# 70536100Listed by: FIVE STAR REAL ESTATE (ADA)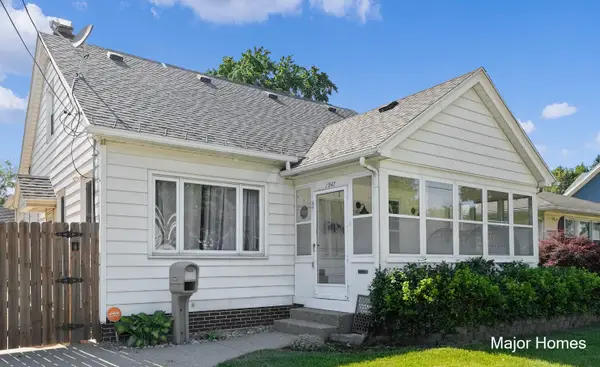 $294,900Pending4 beds 2 baths1,772 sq. ft.
1947 Blandford Avenue SW, Wyoming, MI 49519
MLS# 65026026499Listed by: KELLER WILLIAMS REALTY RIVERTOWN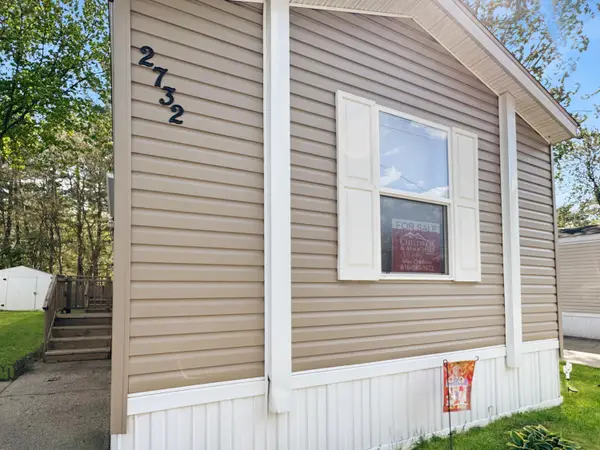 $69,900Active2 beds 2 baths1,056 sq. ft.
2732 Timmins Street Sw, Wyoming, MI 49519
MLS# 26026337Listed by: CHILDRESS ASSOCIATES REALTY $439,900Active3 beds 3 baths2,114 sq. ft.
5131 Windybrook Drive Sw, Grandville, MI 49418
MLS# 26026153Listed by: HOMESTEAD REALTY OF W MICHIGAN $229,900Pending4 beds 1 baths1,140 sq. ft.
18 34th Street SW, GrandRapids, MI 49548
MLS# 65026025757Listed by: FIVE STAR REAL ESTATE (GRANDV) $160,000Pending2 beds 2 baths1,008 sq. ft.
2028 Denwood Avenue SW, Wyoming, MI 49509
MLS# 65026025768Listed by: MICHIGAN TOP PRODUCERS $510,000Pending-- beds -- baths3,876 sq. ft.
1870 Prairie Parkway SW, Wyoming, MI 49519
MLS# 65026025716Listed by: RE/MAX SUNQUEST REALTY $375,000Pending4 beds 2 baths2,039 sq. ft.
1783 Durango Court Sw, Wyoming, MI 49519
MLS# 26025659Listed by: COLDWELL BANKER SCHMIDT REALTORS $489,000Active7 beds 4 baths2,457 sq. ft.
5495 Lilly, Wyoming, MI 49509
MLS# 70535001Listed by: SUCCESS REALTY WEST MICHIGAN $74,900Active2 beds 2 baths1,003 sq. ft.
5208 Village Drive Sw, Wyoming, MI 49509
MLS# 26025160Listed by: CHILDRESS ASSOCIATES REALTY $354,900Pending3 beds 3 baths1,768 sq. ft.
4819 Stonewood River Avenue SW, Wyoming, MI 49418
MLS# 65026025078Listed by: DEVOS REALTY LLC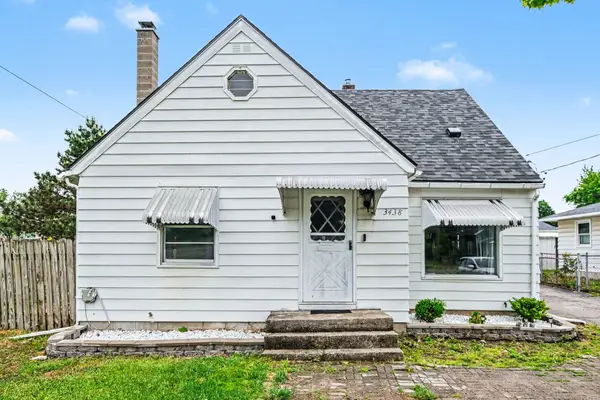 $299,900Pending4 beds 2 baths1,375 sq. ft.
3438 Byron Center Avenue SW, Wyoming, MI 49519
MLS# 65026024651Listed by: KEY REALTY $249,900Active3 beds 2 baths1,378 sq. ft.
1939 Delwood SW AVE, Wyoming, MI 49509
MLS# 58050208765Listed by: EXP REALTY LLC $260,000Pending3 beds 2 baths1,408 sq. ft.
2051 Michael, Wyoming, MI 49509
MLS# 70534011Listed by: FIVE STAR REAL ESTATE (GRANDV)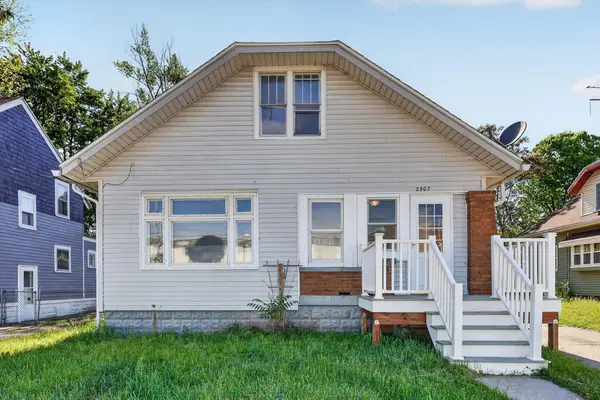 $280,000Pending3 beds 1 baths1,656 sq. ft.
2307 Beverly Avenue SW, Wyoming, MI 49519
MLS# 65026023877Listed by: BELLABAY REALTY LLC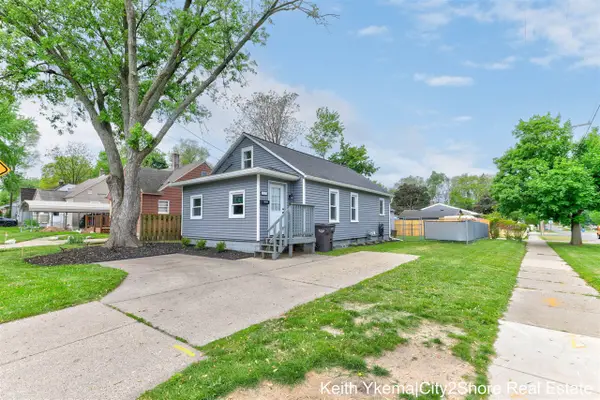 $234,900Pending4 beds 1 baths1,039 sq. ft.
2603 Noel, Wyoming, MI 49509
MLS# 70533174Listed by: CITY2SHORE REAL ESTATE INC.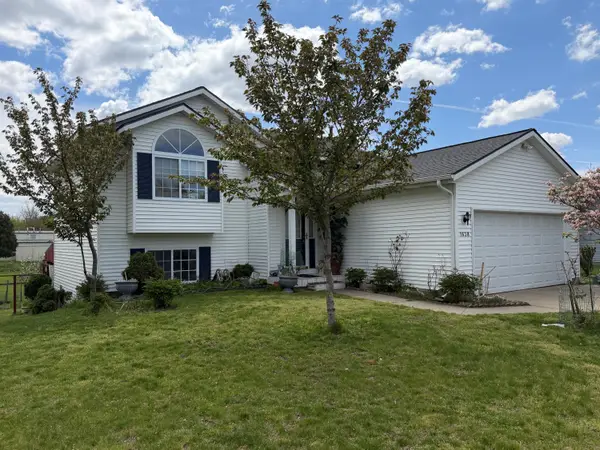 $360,000Pending4 beds 2 baths1,893 sq. ft.
1638 Steff Court SW, Wyoming, MI 49519
MLS# 65026021258Listed by: HOMES 28 $279,900Pending3 beds 2 baths1,636 sq. ft.
1049 Buckingham Street SW, Wyoming, MI 49509
MLS# 65026017708Listed by: HOME REALTY LLC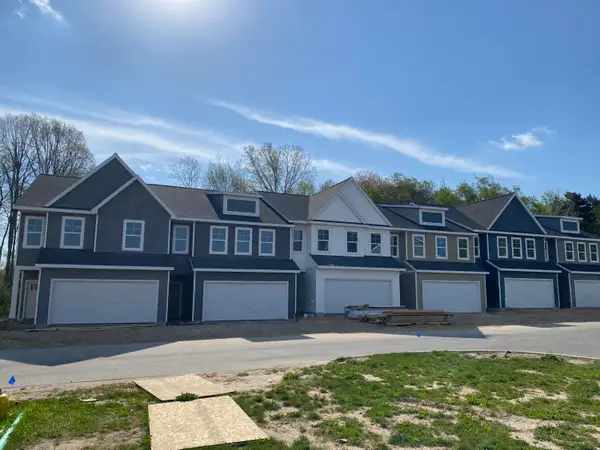 $346,647Pending3 beds 3 baths1,854 sq. ft.
4858 Hidden River Avenue SW Unit: 57, Wyoming, MI 49418
MLS# 65026018028Listed by: DEVOS REALTY LLC $348,476Pending3 beds 3 baths1,854 sq. ft.
4864 Hidden River Avenue SW Unit: 58, Wyoming, MI 49418
MLS# 65026018031Listed by: DEVOS REALTY LLC $284,900Pending3 beds 1 baths1,155 sq. ft.
2663 Wyoming Avenue SW, Wyoming, MI 49519
MLS# 65026018122Listed by: FIVE STAR REAL ESTATE (GRANDV) $118,470Pending2 beds 1 baths652 sq. ft.
2856 Longstreet Avenue SW, Wyoming, MI 49509
MLS# 65026019474Listed by: 616 REALTY LLC $240,000Pending3 beds 1 baths1,850 sq. ft.
1620 Delwood Avenue SW, Wyoming, MI 49509
MLS# 65026021716Listed by: EPIQUE REALTY $299,900Active4 beds 3 baths1,520 sq. ft.
3329 Hubal Avenue Sw, Wyoming, MI 49519
MLS# 26021042Listed by: ENSLEY REAL ESTATE $234,900Active-- beds -- baths
2029 Arnold, Wyoming, MI 49509
MLS# 70530582Listed by: CITY2SHORE REAL ESTATE (GR) $232,500Active2 beds 2 baths1,058 sq. ft.
4874 Ausable River #7, Wyoming, MI 49418
MLS# 70530231Listed by: SMALLEGAN REAL ESTATE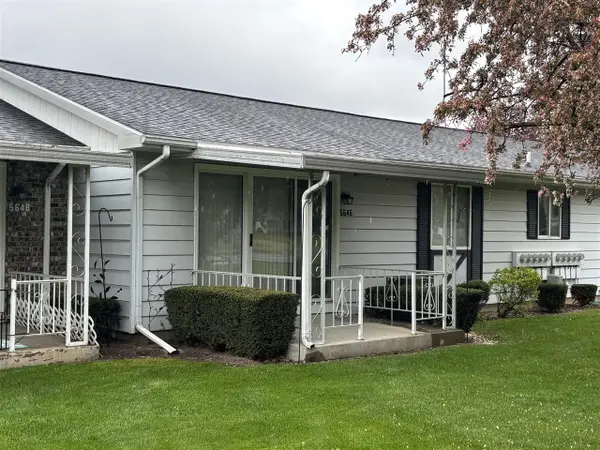 $162,500Pending2 beds 1 baths870 sq. ft.
5646 Leisure S, Grand Rapids, MI 49548
MLS# 70528358Listed by: WEICHERT REALTORS PLAT (MAIN) $239,900Active2 beds 1 baths784 sq. ft.
3230 Highgate, Wyoming, MI 49509
MLS# 70527482Listed by: CARR GROUP $139,999Active1.1 Acres
V/L 52nd Street Sw, Grandville, MI 49418
MLS# 26017432Listed by: REVIVIFY PROPERTIES $472,900Pending4 beds 3 baths2,616 sq. ft.
5492 Case Drive SW, Wyoming, MI 49418
MLS# 65026015625Listed by: MICHIGAN TOP PRODUCERS $315,000Pending4 beds 3 baths2,211 sq. ft.
3834 Wyoming Avenue SW, Wyoming, MI 49519
MLS# 65026015586Listed by: INDEPENDENCE REALTY (MAIN) $129,900Pending4 beds 2 baths1,224 sq. ft.
4595 Quebec Avenue SW, Wyoming, MI 49519
MLS# 65026015332Listed by: FIVE STAR REAL ESTATE (M6) $259,900Pending4 beds 1 baths837 sq. ft.
40 41st, Grand Rapids, MI 49548
MLS# 70524694Listed by: KELLER WILLIAMS GR EAST $105,000Active3 beds 2 baths1,152 sq. ft.
2762 Regina Street Sw #338, Wyoming, MI 49519
MLS# 26014879Listed by: KELLER WILLIAMS GR EAST $238,900Pending3 beds 2 baths1,216 sq. ft.
3755 Jefferson, Wyoming, MI 49548
MLS# 70522998Listed by: FIVE STAR REAL ESTATE $619,900Pending3 beds 3 baths2,244 sq. ft.
5565 Albright Avenue Sw, Grandville, MI 49418
MLS# 26013248Listed by: COLDWELL BANKER WOODLAND SCHMIDT $221,900Pending3 beds 1 baths1,294 sq. ft.
1955 Hendricks Avenue SW, Wyoming, MI 49509
MLS# 65026012343Listed by: WINDPOINT REALTY LLC $349,839Pending3 beds 3 baths1,852 sq. ft.
4846 Hidden River Avenue SW Unit: 55, Wyoming, MI 49418
MLS# 65026011039Listed by: DEVOS REALTY LLC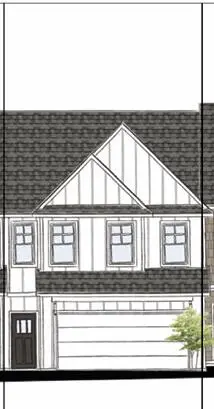 $349,087Pending3 beds 3 baths1,862 sq. ft.
4852 Hidden River Avenue SW Unit: 56, Wyoming, MI 49418
MLS# 65026011042Listed by: DEVOS REALTY LLC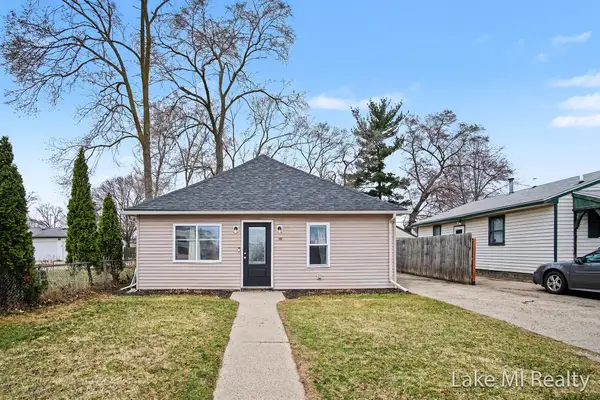 $235,000Active3 beds 1 baths1,602 sq. ft.
3809 Jefferson Avenue Se, Wyoming, MI 49548
MLS# 26010944Listed by: LAKE MICHIGAN REALTY MGMT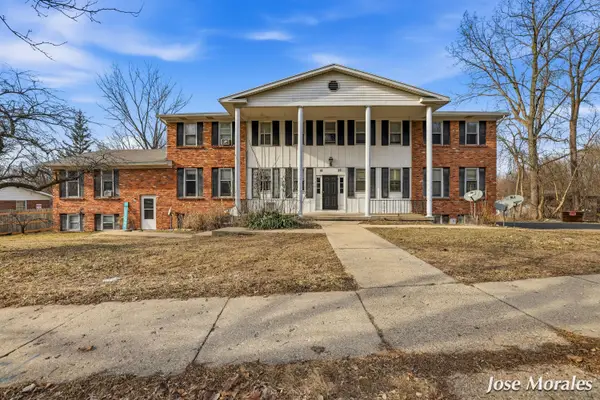 $849,900Pending-- beds -- baths
1833 Prairie Parkway SW, Wyoming, MI 49519
MLS# 65026009302Listed by: EPIQUE REALTY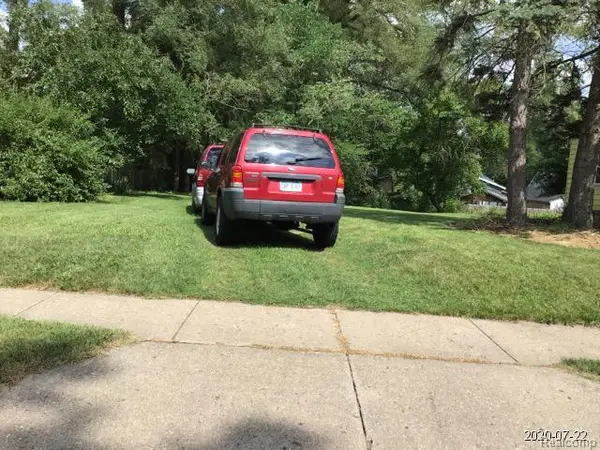 $45,000Pending0.19 Acres
2048 Wyoming, Wyoming, MI 49519
MLS# 60973478Listed by: ARG REALTY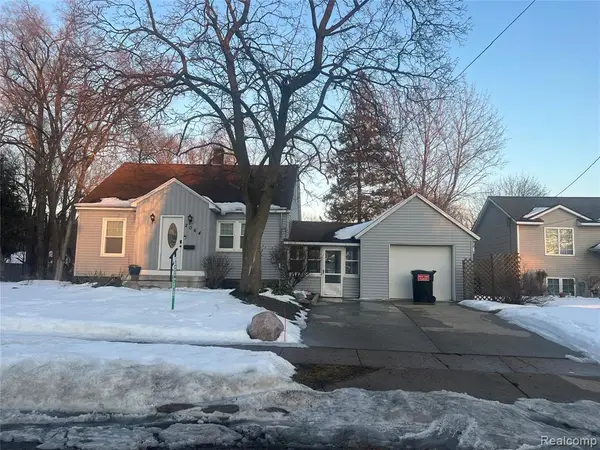 $174,900Pending3 beds 1 baths942 sq. ft.
2064 Wyoming, Wyoming, MI 49519
MLS# 60973142Listed by: ARG REALTY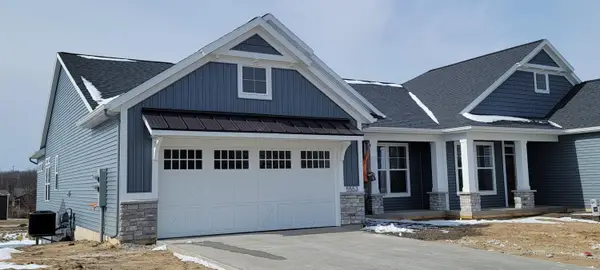 $500,000Active3 beds 3 baths1,560 sq. ft.
5553 Canal Avenue SW Building: * Unit: 64, Wyoming, MI 49418
MLS# 65026006847Listed by: KENSINGTON REALTY GROUP INC.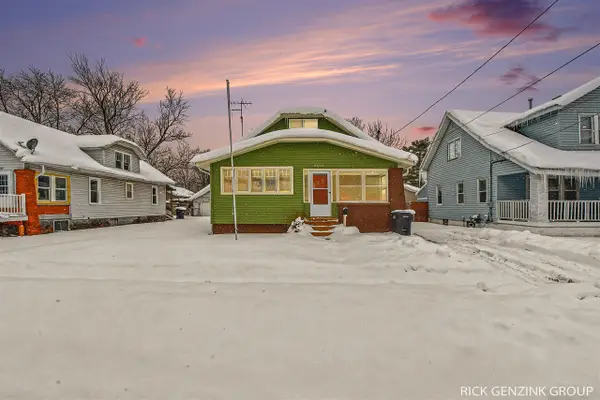 $280,000Pending4 beds 2 baths1,664 sq. ft.
2303 Beverly, Wyoming, MI 49519
MLS# 70515840Listed by: KELLER WILLIAMS HARBORTOWN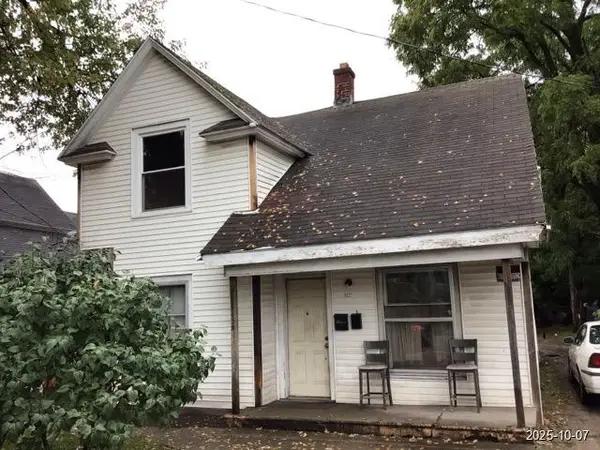 $139,900Pending-- beds -- baths
1459 Godfrey Avenue SW, Wyoming, MI 49509
MLS# 67026005939Listed by: DEBARTOLO REALTY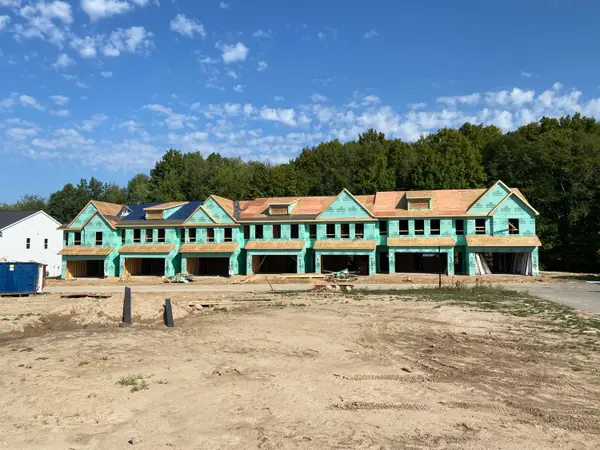 $368,124Pending3 beds 3 baths1,852 sq. ft.
4870 Hidden River Avenue SW Unit: 59, Wyoming, MI 49418
MLS# 65026005866Listed by: DEVOS REALTY LLC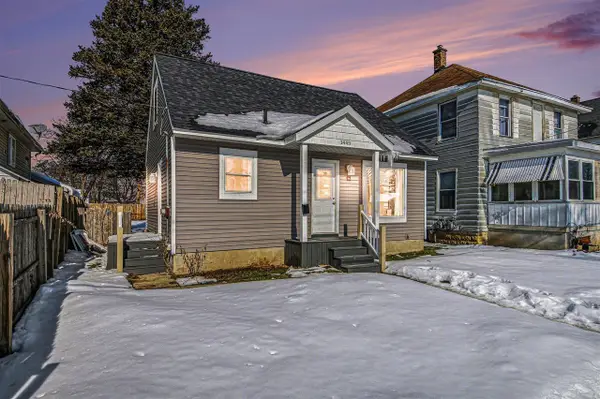 $226,000Pending3 beds 1 baths780 sq. ft.
1443 Rathbone, Wyoming, MI 49509
MLS# 70515535Listed by: THE LOCAL ELEMENT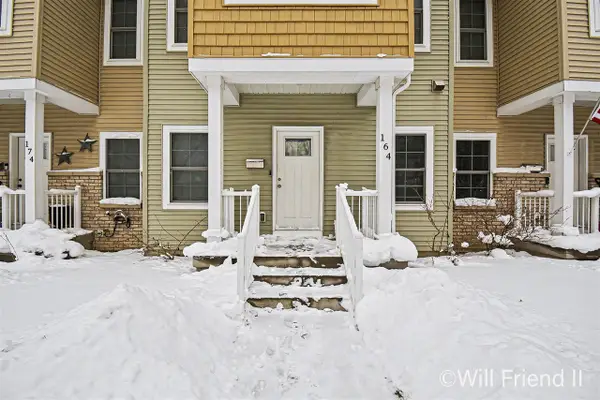 $279,900Active3 beds 3 baths1,490 sq. ft.
164 Wexford, Grand Rapids, MI 49548
MLS# 70513079Listed by: FIVE STAR REAL ESTATE (GRANDV)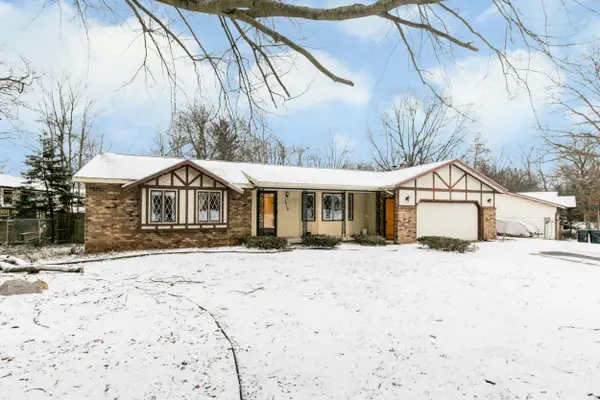 $355,000Pending3 beds 3 baths1,514 sq. ft.
1619 Sentinal Street SW, Wyoming, MI 49519
MLS# 65026002110Listed by: KELLER WILLIAMS GR NORTH $850,000Active5 beds 4 baths4,356 sq. ft.
4335 56th Street Sw, Wyoming, MI 49418
MLS# 25058796Listed by: GREENRIDGE REALTY (KENTWOOD) $759,900Active4 beds 3 baths2,251 sq. ft.
5508 Case Drive Sw, Wyoming, MI 49418
MLS# 25056705Listed by: BELLABAY REALTY LLC $339,900Pending4 beds 2 baths2,244 sq. ft.
3628 SW Wyoming AVE, Wyoming, MI 49519
MLS# 61050190210Listed by: KELLER WILLIAMS PREFERRED $525,000Active3 beds 3 baths2,234 sq. ft.
5460 Albright Avenue Sw #47, Grandville, MI 49418
MLS# 25040187Listed by: KENSINGTON REALTY GROUP INC. $69,900Pending5 beds 2 baths1,000 sq. ft.
823 Dolphin Street Sw, Wyoming, MI 49509
MLS# 25034771Listed by: LAKE MICHIGAN REALTY MGMT $95,000Active0.3 Acres
4475 56th Street Sw, Wyoming, MI 49418
MLS# 25013999Listed by: BELLABAY REALTY LLC
Local realty services provided by:CENTURY 21 Metro Brokers, CENTURY 21 Affiliated, CENTURY 21 Signature Realty
Neighborhoods near Wyoming, MI
Zip codes near Wyoming, MI
- 49301 homes for sale
- 49315 homes for sale
- 49316 homes for sale
- 49418 homes for sale
- 49426 homes for sale
- 49428 homes for sale
- 49503 homes for sale
- 49504 homes for sale
- 49505 homes for sale
- 49506 homes for sale
- 49507 homes for sale
- 49508 homes for sale
- 49509 homes for sale
- 49512 homes for sale
- 49519 homes for sale
- 49525 homes for sale
- 49534 homes for sale
- 49544 homes for sale
- 49546 homes for sale
- 49548 homes for sale
Popular searches near Wyoming, MI
- Byron Township homes for sale
- Byron Center homes for sale
- Caledonia homes for sale
- Cascade homes for sale
- Comstock Park homes for sale
- Cutlerville homes for sale
- East Grand Rapids homes for sale
- Forest Hills homes for sale
- Gaines homes for sale
- Georgetown homes for sale
- Grand Rapids Charter Township homes for sale
- Grand Rapids homes for sale
- Grandville homes for sale
- Hudsonville homes for sale
- Jamestown homes for sale
- Jenison homes for sale
- Kentwood homes for sale
- Northview homes for sale
- Tallmadge homes for sale
- Walker homes for sale
Protect your home and budget from life's surprises with an Assurant Home Warranty, backed by a partner that supports you through every step of homeownership. Explore Plans.
©2026 Century 21 Real Estate LLC. All rights reserved. CENTURY 21®, the CENTURY 21 Logo and C21® are service marks owned by Century 21 Real Estate LLC. Century 21 Real Estate LLC fully supports the principles of the Fair Housing Act and the Equal Opportunity Act. Each office is independently owned and operated. Listing information is deemed reliable but not guaranteed accurate.