- Anthony, Muncie homes for sale
- Avalon of Fishers, Fishers homes for sale
- Canal Place, Fishers homes for sale
- Carlton, Muncie homes for sale
- Gray Eagle, Fishers homes for sale
- Halteman, Muncie homes for sale
- Norwood, Muncie homes for sale
- Old West End, Muncie homes for sale
- Riverside, Muncie homes for sale
- Robinwood, Muncie homes for sale
- Saddle Brook at Crano Estates, Muncie homes for sale
- Sandstone, Fishers homes for sale
- Saxony, Fishers homes for sale
- South Central, Muncie homes for sale
- Thomas Park, Muncie homes for sale
- University Heights, Muncie homes for sale
- Westbridge, Muncie homes for sale
- Westbrier, Muncie homes for sale
- Westridge, Muncie homes for sale
- Westside, Muncie homes for sale
Anderson, IN - homes for sale
300 of 469 results displayed
- New
 $149,900Active3 beds 1 baths2,072 sq. ft.
3622 E Lynn Street, Anderson, IN 46013
MLS# 22116990Listed by: @HOME INDIANA - New
 $264,900Active3 beds 2 baths1,774 sq. ft.
2498 E 100 N, Anderson, IN 46012
MLS# 22116991Listed by: KELLER WILLIAMS INDY METRO NE - New
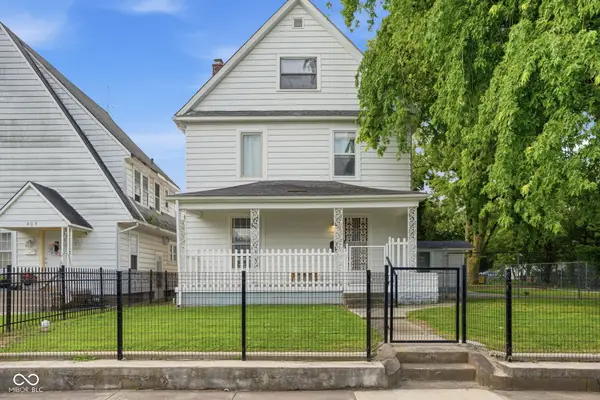 $225,000Active5 beds 3 baths3,524 sq. ft.
409 W 7th Street, Anderson, IN 46016
MLS# 22116040Listed by: F.C. TUCKER COMPANY 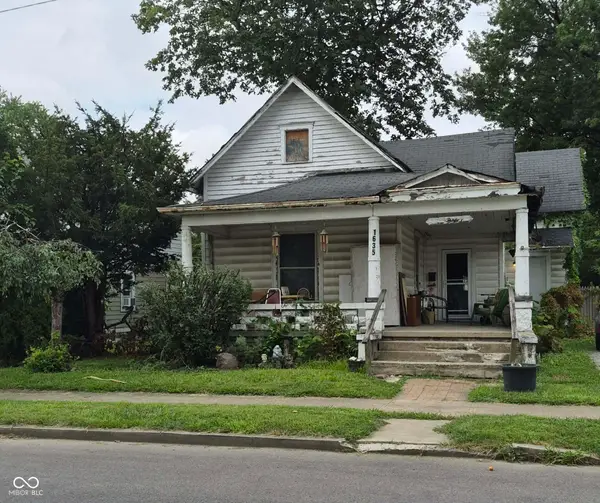 $45,000Pending5 beds 2 baths1,872 sq. ft.
1635 Fletcher Street, Anderson, IN 46016
MLS# 22116712Listed by: BERKSHIRE HATHAWAY HOME- New
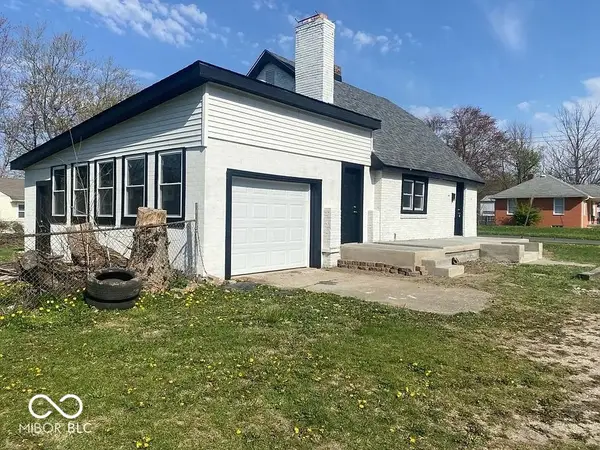
 $290,000Active3 beds 3 baths2,658 sq. ft.
2843 Rand Lane, Anderson, IN 46013
MLS# 22111510Listed by: F.C. TUCKER COMPANY - New
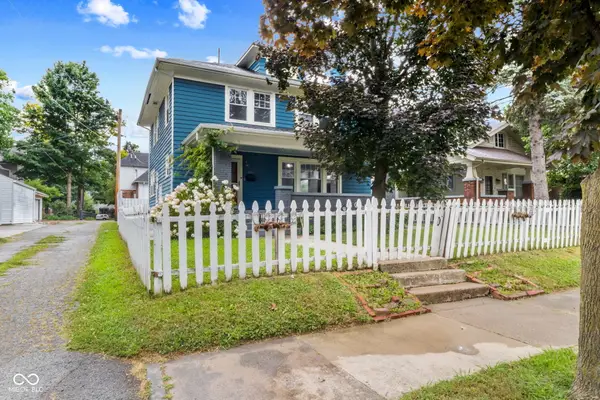
 $145,000Active3 beds 1 baths957 sq. ft.
705 Lennox Street, Anderson, IN 46012
MLS# 22113866Listed by: KELLER WILLIAMS INDY METRO NE - New
 $179,900Active2 beds 3 baths1,422 sq. ft.
4317 Heathrow Drive, Anderson, IN 46013
MLS# 22116697Listed by: RE/MAX REAL ESTATE SOLUTIONS - New
 $164,900Active2 beds 1 baths918 sq. ft.
5028 Columbus Avenue, Anderson, IN 46013
MLS# 22116758Listed by: KELLER WILLIAMS INDY METRO NE - New
 $150,000Active4 beds 2 baths1,922 sq. ft.
925 W 7th Street, Anderson, IN 46016
MLS# 22116731Listed by: GREEN FOREST REALTY - New
 $150,000Active3 beds 2 baths2,316 sq. ft.
2519 Jackson Street, Anderson, IN 46016
MLS# 22116763Listed by: EXP REALTY, LLC - New
 $125,000Active-- beds -- baths
2403 Fletcher, Anderson, IN 46016
MLS# 22116734Listed by: KELLER WILLIAMS INDY METRO PARTNERS - New
 $90,000Active5.25 Acres
300 South, Anderson, IN 46013
MLS# 22116695Listed by: WHITETAIL PROPERTIES  $130,000Pending3 beds 2 baths4,082 sq. ft.
3100 Sheridan Street, Anderson, IN 46016
MLS# 22116644Listed by: RE/MAX REAL ESTATE SOLUTIONS- New
 $595,000Active3 beds 4 baths3,698 sq. ft.
924 Woodcrest Way, Anderson, IN 46012
MLS# 22116562Listed by: RE/MAX REALTY SERVICES - New
 $129,900Active3 beds 1 baths1,340 sq. ft.
612 Hawthorne Avenue, Anderson, IN 46011
MLS# 22112841Listed by: RIGHT HOME REALTY LLC - New
 $97,000Active4 beds 1 baths2,044 sq. ft.
327 E 37th Street, Anderson, IN 46013
MLS# 22116023Listed by: REAL BROKER, LLC - New
 $92,000Active3 beds 1 baths1,752 sq. ft.
308 E 38th Street, Anderson, IN 46013
MLS# 22116010Listed by: REAL BROKER, LLC - New
 $194,900Active3 beds 1 baths1,175 sq. ft.
4903 Southern Avenue, Anderson, IN 46013
MLS# 22114592Listed by: EVER REAL ESTATE, LLC - New
 $210,000Active4 beds 2 baths2,232 sq. ft.
1317 Chesterfield Drive, Anderson, IN 46012
MLS# 22115716Listed by: F.C. TUCKER COMPANY - New
 $249,900Active3 beds 2 baths1,390 sq. ft.
1520 E 42nd Street, Anderson, IN 46013
MLS# 22115569Listed by: RE/MAX REAL ESTATE SOLUTIONS - New
 $489,900Active3 beds 3 baths3,696 sq. ft.
3451 Alexandria Pike, Anderson, IN 46012
MLS# 22113655Listed by: KELLER WILLIAMS INDY METRO PARTNERS  $210,000Pending3 beds 2 baths1,535 sq. ft.
2812 Greenbriar Road, Anderson, IN 46011
MLS# 22115424Listed by: MARK DIETEL REALTY, LLC- New
 $220,000Active3 beds 2 baths1,522 sq. ft.
1008 Ranike Drive, Anderson, IN 46012
MLS# 22116017Listed by: JUST HOMES REALTY - New
 $127,400Active2 beds 1 baths884 sq. ft.
3611 E Lynn Street, Anderson, IN 46013
MLS# 22115785Listed by: RE/MAX REAL ESTATE SOLUTIONS - New
 $149,900Active3 beds 1 baths1,161 sq. ft.
105 E Vinyard, Anderson, IN 46012
MLS# 22115588Listed by: RE/MAX REAL ESTATE SOLUTIONS - New
 $205,000Active3 beds 2 baths1,080 sq. ft.
2411 Sheffield Avenue, Anderson, IN 46011
MLS# 22115580Listed by: F.C. TUCKER/PROSPERITY - New
 $155,000Active2 beds 2 baths1,083 sq. ft.
4125 Burton Place Court, Anderson, IN 46013
MLS# 22114939Listed by: CARPENTER, REALTORS - New
 $219,900Active3 beds 2 baths1,376 sq. ft.
2269 N 200 W, Anderson, IN 46011
MLS# 22115383Listed by: PILLARIO PROPERTY MANAGEMENT LLC - New
 $114,900Active2 beds 1 baths868 sq. ft.
3808 Brown Street, Anderson, IN 46013
MLS# 22115503Listed by: RED BRIDGE REAL ESTATE - Open Sun, 1 to 2pmNew
 $0Active3 beds 2 baths1,565 sq. ft.
1926 Southwoods Road, Anderson, IN 46012
MLS# 202629260Listed by: NESS BROS. REALTORS & AUCTIONE  $98,000Pending2 beds 1 baths924 sq. ft.
814 W 5th Street, Anderson, IN 46016
MLS# 22115188Listed by: KELLER WILLIAMS INDY METRO NE- New
 $164,900Active3 beds 2 baths1,008 sq. ft.
815 Delmar Road, Anderson, IN 46013
MLS# 22115482Listed by: RED BRIDGE REAL ESTATE - New
 $275,000Active4 beds 4 baths2,652 sq. ft.
3124 E 5th Street, Anderson, IN 46012
MLS# 22115331Listed by: ABUNDANT ROOTS REAL ESTATE - New
 $139,900Active3 beds 2 baths1,322 sq. ft.
724 Lonsvale Drive, Anderson, IN 46013
MLS# 22114394Listed by: GOLDEN RULE REALTY, LLC  $285,000Active3 beds 2 baths1,455 sq. ft.
122 Norris Drive, Anderson, IN 46013
MLS# 22114778Listed by: PARADIGM REALTY SOLUTIONS $125,000Pending3 beds 2 baths1,128 sq. ft.
4413 Brenda Drive, Anderson, IN 46013
MLS# 22114662Listed by: F.C. TUCKER/PROSPERITY $325,000Pending3 beds 3 baths2,269 sq. ft.
317 Edgewood Place E, Anderson, IN 46011
MLS# 22114799Listed by: KELLER WILLIAMS INDY METRO NE $135,000Active2 beds 1 baths800 sq. ft.
3729 Burton Place, Anderson, IN 46013
MLS# 202628854Listed by: BERKSHIRE HATHAWAY INDIANA REALTY $375,000Active5 beds 3 baths5,151 sq. ft.
2226 Chevelle Court, Anderson, IN 46012
MLS# 22114110Listed by: PILLARIO PROPERTY MANAGEMENT LLC $255,000Active3 beds 2 baths1,777 sq. ft.
2020 S Winding Way, Anderson, IN 46011
MLS# 22114617Listed by: F.C. TUCKER COMPANY $289,900Active1 beds 2 baths1,832 sq. ft.
2110 Dena Drive, Anderson, IN 46017
MLS# 202628757Listed by: RE/MAX REAL ESTATE GROUPS $150,000Active2 beds 1 baths1,082 sq. ft.
2411 E 5th Street, Anderson, IN 46012
MLS# 22114770Listed by: RE/MAX REAL ESTATE SOLUTIONS $289,900Active3 beds 3 baths3,100 sq. ft.
5037 Timberwood Circles, Anderson, IN 46012
MLS# 22114659Listed by: PRIME LOCATION REAL ESTATE GROUP LLC $90,000Active2 beds 1 baths825 sq. ft.
1409 Dewey Street, Anderson, IN 46016
MLS# 22114696Listed by: KELLER WILLIAMS INDY METRO NE $64,900Active3 beds 1 baths1,725 sq. ft.
1830 Walnut Street, Anderson, IN 46016
MLS# 22114645Listed by: LIBERTAD REAL ESTATE CO., LLC $370,000Active4 beds 3 baths2,516 sq. ft.
5 Windridge, Anderson, IN 46011
MLS# 22113571Listed by: COLDWELL BANKER - KAISER $47,250Active2 beds 1 baths792 sq. ft.
2224 Lafayette Street, Anderson, IN 46012
MLS# 22114007Listed by: REMAX ONE $229,900Active4 beds 2 baths1,748 sq. ft.
1112 North Drive, Anderson, IN 46011
MLS# 22113863Listed by: REALTY WORLD INDY $349,900Pending3 beds 3 baths2,425 sq. ft.
866 Westgate Drive, Anderson, IN 46012
MLS# 22113904Listed by: KELLER WILLIAMS INDY METRO NE $231,000Pending3 beds 2 baths1,363 sq. ft.
3705 E Willow Way, Anderson, IN 46017
MLS# 22114415Listed by: WEIGHTMAN REALTY GROUP, LLC $260,000Active4 beds 3 baths2,183 sq. ft.
1124 Pebble Court, Anderson, IN 46013
MLS# 22114119Listed by: 1 PERCENT LISTS INDIANA REAL ESTATE $109,997Active-- beds -- baths
1309 Pearl Street, Anderson, IN 46016
MLS# 22114339Listed by: PMI INDIANAPOLIS $299,900Active3 beds 2 baths1,920 sq. ft.
2312 N 200 E, Anderson, IN 46012
MLS# 202628196Listed by: NEXTHOME ELITE REAL ESTATE $549,900Active3 beds 3 baths3,810 sq. ft.
1607 Van Buskirk Road, Anderson, IN 46011
MLS# 22113518Listed by: RE/MAX REAL ESTATE SOLUTIONS $120,000Active4 beds 2 baths1,878 sq. ft.
2317 Jackson Street, Anderson, IN 46016
MLS# 22113895Listed by: STARR REAL ESTATE LLC $120,000Active4 beds 2 baths1,626 sq. ft.
303 W 2nd Street, Anderson, IN 46016
MLS# 22113896Listed by: STARR REAL ESTATE LLC $79,900Active2 beds 1 baths869 sq. ft.
1717 Johnson Avenue, Anderson, IN 46016
MLS# 22113729Listed by: RE/MAX REAL ESTATE SOLUTIONS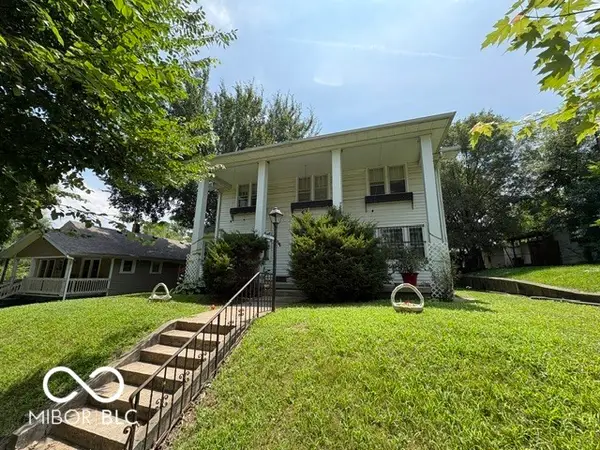 $159,000Active4 beds 2 baths3,012 sq. ft.
1409 W 14th Street, Anderson, IN 46016
MLS# 22113803Listed by: STARR REAL ESTATE LLC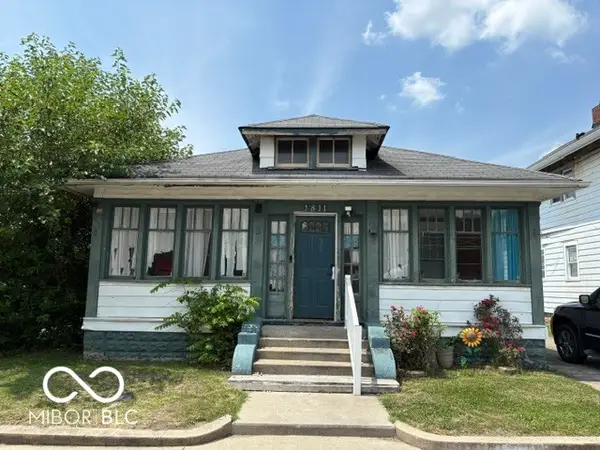 $120,000Active4 beds 1 baths1,204 sq. ft.
1811 Main Street, Anderson, IN 46016
MLS# 22113893Listed by: STARR REAL ESTATE LLC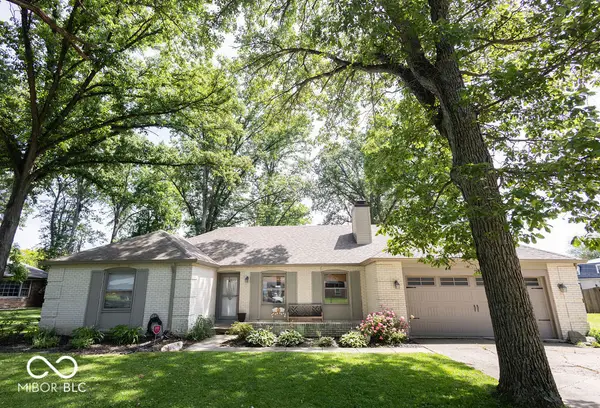 $239,900Active3 beds 2 baths1,670 sq. ft.
2427 Shady Lane, Anderson, IN 46011
MLS# 22113908Listed by: HIGHGARDEN REAL ESTATE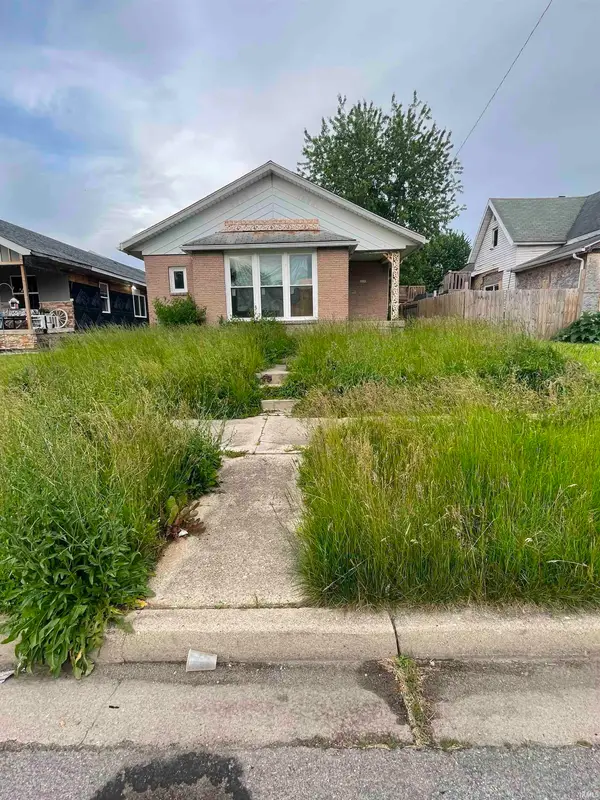 $35,000Pending3 beds 1 baths1,419 sq. ft.
2630 Meridian Street, Anderson, IN 46016
MLS# 202628012Listed by: KMD REAL ESTATE LLC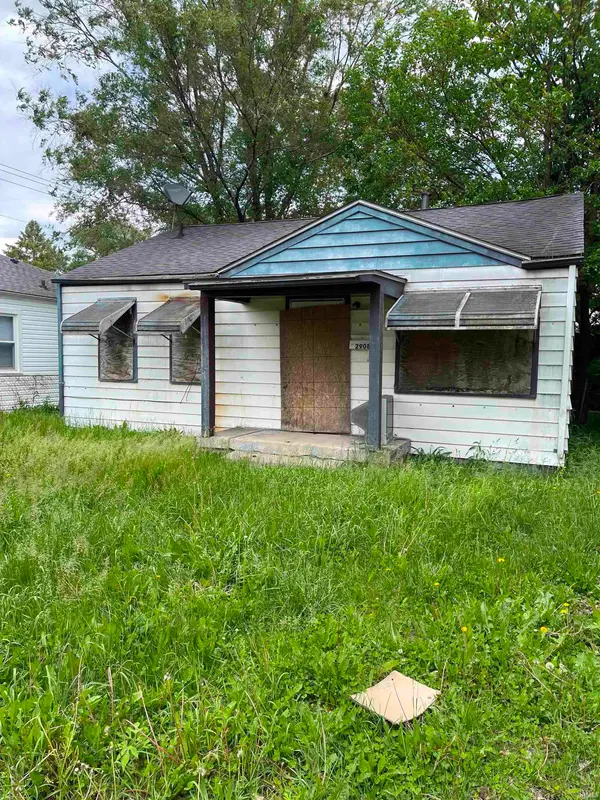 $27,500Active2 beds 1 baths810 sq. ft.
2908 Central Avenue, Anderson, IN 46016
MLS# 202628021Listed by: KMD REAL ESTATE LLC $219,000Pending4 beds 3 baths2,971 sq. ft.
3219 Greenbriar Road, Anderson, IN 46011
MLS# 202628003Listed by: COLDWELL BANKER REAL ESTATE GROUP $190,000Pending3 beds 2 baths1,689 sq. ft.
1206 Sugar Pine Drive, Anderson, IN 46012
MLS# 22111149Listed by: CARPENTER, REALTORS $109,000Active4 beds 2 baths1,356 sq. ft.
1305 Nichol Avenue, Anderson, IN 46016
MLS# 22113762Listed by: STARR REAL ESTATE LLC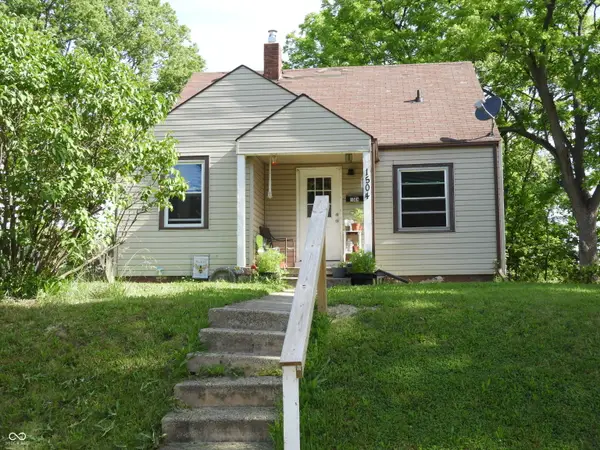 $139,997Active3 beds 1 baths1,598 sq. ft.
1504 W 11th Street, Anderson, IN 46016
MLS# 22113577Listed by: PMI INDIANAPOLIS $149,999Active4 beds 1 baths2,148 sq. ft.
1916 Main Street, Anderson, IN 46016
MLS# 22110500Listed by: HIGHGARDEN REAL ESTATE $200,000Active-- beds -- baths
1202 E 8th, Anderson, IN 46012
MLS# 22111608Listed by: KELLER WILLIAMS INDY METRO PARTNERS $20,000Active0.54 Acres
0 Silver Street, Anderson, IN 46012
MLS# 22113527Listed by: RE/MAX REAL ESTATE SOLUTIONS $200,000Active-- beds -- baths
604 Hendricks Street, Anderson, IN 46016
MLS# 22111615Listed by: KELLER WILLIAMS INDY METRO PARTNERS $289,900Active2 beds 2 baths1,684 sq. ft.
226 Saratoga Way, Anderson, IN 46013
MLS# 22113398Listed by: RE/MAX LEGACY $34,900Active3 beds 1 baths872 sq. ft.
2255 Arrow Avenue, Anderson, IN 46016
MLS# 22113480Listed by: REALTY WEALTH ADVISORS $34,900Active4 beds 2 baths1,688 sq. ft.
2200 Walnut Street, Anderson, IN 46016
MLS# 22113481Listed by: REALTY WEALTH ADVISORS $134,900Active2 beds 1 baths884 sq. ft.
2436 Brown Street, Anderson, IN 46016
MLS# 22113260Listed by: RE/MAX COMPLETE $145,000Pending3 beds 1 baths925 sq. ft.
1803 W Fairlawn Way, Anderson, IN 46011
MLS# 22111530Listed by: F.C. TUCKER COMPANY $215,000Active3 beds 2 baths1,858 sq. ft.
1909 W 27th, Anderson, IN 46016
MLS# 22113089Listed by: F.C. TUCKER COMPANY $269,900Pending4 beds 2 baths1,824 sq. ft.
1007 Parkway Drive, Anderson, IN 46012
MLS# 22113095Listed by: RE/MAX ADVANCED REALTY $136,000Pending2 beds 1 baths984 sq. ft.
3024 Saint Charles Street, Anderson, IN 46016
MLS# 22113262Listed by: KELLER WILLIAMS INDY METRO NE $24,000Active2 beds 1 baths1,449 sq. ft.
1512 Ohio Avenue, Anderson, IN 46016
MLS# 202627408Listed by: LEAVELL REAL ESTATE $225,000Active5 beds 2 baths2,732 sq. ft.
817 W 5th Street, Anderson, IN 46016
MLS# 22113219Listed by: RED HOT, REALTORS LLC $334,900Active3 beds 2 baths1,786 sq. ft.
815 Stewart Road, Anderson, IN 46012
MLS# 22112503Listed by: KELLER WILLIAMS INDY METRO PARTNERS $70,000Active2 beds 1 baths975 sq. ft.
1610 Central Avenue, Anderson, IN 46016
MLS# 22112163Listed by: F.C. TUCKER COMPANY $189,900Pending3 beds 2 baths1,503 sq. ft.
920 Shellbark Road, Anderson, IN 46011
MLS# 22112858Listed by: COLDWELL BANKER - KAISER $180,000Pending3 beds 2 baths1,386 sq. ft.
3007 E 6th Street, Anderson, IN 46012
MLS# 22113080Listed by: RE/MAX REAL ESTATE SOLUTIONS- Open Sun, 1 to 3pm
 $180,000Active3 beds 2 baths2,148 sq. ft.
1124 E 10th Street, Anderson, IN 46012
MLS# 22113035Listed by: RE/MAX REAL ESTATE SOLUTIONS  $258,000Active3 beds 3 baths1,826 sq. ft.
1727 Oakwood Drive, Anderson, IN 46011
MLS# 22113037Listed by: RE/MAX REAL ESTATE SOLUTIONS $254,900Active3 beds 2 baths1,740 sq. ft.
3531 Tudor Road, Anderson, IN 46012
MLS# 22112972Listed by: TOTALIS REAL ESTATE SOLUTIONS $219,000Active2 beds 2 baths1,267 sq. ft.
3419 Village Drive, Anderson, IN 46011
MLS# 22112376Listed by: RE/MAX REAL ESTATE SOLUTIONS $189,900Active2 beds 2 baths1,271 sq. ft.
615 Country Club Lane, Anderson, IN 46011
MLS# 22112909Listed by: EXP REALTY, LLC $67,900Active3 beds 1 baths940 sq. ft.
619 E 27th Street, Anderson, IN 46016
MLS# 22112772Listed by: RE/MAX REAL ESTATE SOLUTIONS $35,000Active1 beds 1 baths520 sq. ft.
616 Ellenhurst Drive, Anderson, IN 46012
MLS# 202627079Listed by: RE/MAX REAL ESTATE GROUPS $54,900Pending3 beds 2 baths1,704 sq. ft.
1021 Lincoln Street, Anderson, IN 46016
MLS# 22112211Listed by: RE/MAX REAL ESTATE SOLUTIONS $169,900Pending3 beds 2 baths1,744 sq. ft.
351 W 37th Street, Anderson, IN 46013
MLS# 22109204Listed by: F.C. TUCKER COMPANY $235,000Pending3 beds 2 baths1,479 sq. ft.
1606 E 7th Street, Anderson, IN 46012
MLS# 22112438Listed by: RE/MAX REAL ESTATE SOLUTIONS $325,000Active4 beds 3 baths3,424 sq. ft.
3367 E 150 N, Anderson, IN 46012
MLS# 22108048Listed by: EXP REALTY, LLC $115,000Active3 beds 1 baths1,128 sq. ft.
905 Crescent Drive, Anderson, IN 46013
MLS# 22112395Listed by: DIVERSE PROPERTY SOLUTIONS IND $149,000Active3 beds 1 baths1,144 sq. ft.
217 Ringwood Way, Anderson, IN 46013
MLS# 22112345Listed by: EPIQUE INC $194,900Pending3 beds 1 baths1,148 sq. ft.
6920 Sheridan Street, Anderson, IN 46013
MLS# 22112447Listed by: RE/MAX LEGACY $349,900Active4 beds 4 baths3,690 sq. ft.
14 Windridge Street, Anderson, IN 46011
MLS# 202626950Listed by: NEXTHOME ELITE REAL ESTATE $229,000Pending3 beds 2 baths1,597 sq. ft.
1715 E 43rd Street, Anderson, IN 46013
MLS# 22104324Listed by: KELLER WILLIAMS INDY METRO NE $270,000Active4 beds 3 baths2,165 sq. ft.
601 Woodmere Drive, Anderson, IN 46011
MLS# 22112264Listed by: F.C. TUCKER/PROSPERITY $190,000Pending5 beds 3 baths2,592 sq. ft.
3212 Hamilton Place, Anderson, IN 46013
MLS# 22112284Listed by: KELLER WILLIAMS INDY METRO NE $199,900Active3 beds 2 baths1,456 sq. ft.
815 W Vinyard Street, Anderson, IN 46011
MLS# 22111545Listed by: PILLARIO PROPERTY MANAGEMENT LLC $299,900Pending3 beds 2 baths1,831 sq. ft.
824 Westgate Drive, Anderson, IN 46012
MLS# 22110483Listed by: CARPENTER, REALTORS $72,900Active2 beds 2 baths1,461 sq. ft.
3615 Hamilton Place, Anderson, IN 46013
MLS# 22111865Listed by: ESTANSION GROUP BY BLP $159,900Pending2 beds 1 baths942 sq. ft.
418 E 53rd Street, Anderson, IN 46013
MLS# 22111910Listed by: REMAX ONE $79,900Pending2 beds 1 baths680 sq. ft.
3635 Hamilton Place, Anderson, IN 46013
MLS# 22111874Listed by: ESTANSION GROUP BY BLP $149,900Active3 beds 2 baths2,000 sq. ft.
1611 Nichol Avenue, Anderson, IN 46016
MLS# 22111871Listed by: TRUEBLOOD REAL ESTATE $190,000Active-- beds -- baths
908 Walnut Street, Anderson, IN 46012
MLS# 22111935Listed by: INSPIRED REALTY $139,000Active3 beds 2 baths928 sq. ft.
2614 Fowler, Anderson, IN 46012
MLS# 22111862Listed by: RE/MAX REAL ESTATE SOLUTIONS $239,900Active3 beds 2 baths1,282 sq. ft.
1214 Stonebridge Drive, Anderson, IN 46013
MLS# 22111434Listed by: RE/MAX COMPLETE $130,000Active2 beds 1 baths921 sq. ft.
9 Dixie Drive, Anderson, IN 46016
MLS# 22111672Listed by: RE/MAX REAL ESTATE SOLUTIONS $230,000Pending3 beds 2 baths1,584 sq. ft.
4504 Denise Drive, Anderson, IN 46017
MLS# 22111151Listed by: ENGEL & VOLKERS $275,000Active3 beds 3 baths1,993 sq. ft.
803 Park Road, Anderson, IN 46011
MLS# 22111886Listed by: KELLER WILLIAMS INDY METRO PARTNERS $199,900Pending4 beds 2 baths2,968 sq. ft.
3434 E 8th, Anderson, IN 46012
MLS# 22111879Listed by: KELLER WILLIAMS INDY METRO PARTNERS $279,990Active4 beds 3 baths2,014 sq. ft.
2084 Derby Way, Memphis, IN 47143
MLS# 202609818Listed by: WJH BROKERAGE IN, LLC $264,990Active4 beds 3 baths1,774 sq. ft.
2086 Derby Way, Memphis, IN 47143
MLS# 202609820Listed by: WJH BROKERAGE IN, LLC $264,990Active4 beds 3 baths2,014 sq. ft.
2085 Derby Way, Memphis, IN 47143
MLS# 202609821Listed by: WJH BROKERAGE IN, LLC $467,500Active3 beds 3 baths3,328 sq. ft.
2307 Starlight Drive, Anderson, IN 46012
MLS# 22111291Listed by: CARPENTER, REALTORS $67,900Active3 beds 1 baths1,470 sq. ft.
3105 Sheridan Street, Anderson, IN 46016
MLS# 22111820Listed by: RE/MAX REAL ESTATE SOLUTIONS $67,900Active3 beds 1 baths1,470 sq. ft.
3009 Fairview Street, Anderson, IN 46016
MLS# 22111857Listed by: RE/MAX REAL ESTATE SOLUTIONS $266,990Active4 beds 3 baths2,014 sq. ft.
2079 Derby Way, Memphis, IN 47143
MLS# 202606445Listed by: WJH BROKERAGE IN, LLC $234,900Pending3 beds 2 baths1,809 sq. ft.
2922 Harbur Boulevard, Anderson, IN 46011
MLS# 22111062Listed by: KELLER WILLIAMS INDY METRO NE $120,000Pending3 beds 1 baths972 sq. ft.
1211 W 7th Street, Anderson, IN 46016
MLS# 22111440Listed by: HIGHGARDEN REAL ESTATE $247,500Pending3 beds 2 baths1,814 sq. ft.
2948 E 100 S, Anderson, IN 46017
MLS# 22111337Listed by: RE/MAX REAL ESTATE SOLUTIONS $650,000Active9.24 Acres
1200 E 26th Street, Anderson, IN 46016
MLS# 22111558Listed by: REALTY OF AMERICA LLC $329,900Active3 beds 2 baths2,615 sq. ft.
4297 W 100 S, Anderson, IN 46011
MLS# 22111584Listed by: TAFLINGER REAL ESTATE GROUP $309,900Active3 beds 2 baths2,390 sq. ft.
2322 N 300 W, Anderson, IN 46011
MLS# 22109609Listed by: CARPENTER, REALTORS $398,900Active4 beds 3 baths2,850 sq. ft.
1905 Woodview Lane, Anderson, IN 46011
MLS# 22111201Listed by: RE/MAX REAL ESTATE SOLUTIONS $59,900Active2 beds 1 baths728 sq. ft.
1311 E 23rd Street, Anderson, IN 46016
MLS# 22111379Listed by: REALTY WEALTH ADVISORS $49,900Active4 beds 1 baths1,108 sq. ft.
2615 Brown Street, Anderson, IN 46016
MLS# 22111380Listed by: REALTY WEALTH ADVISORS $549,900Pending3 beds 3 baths2,900 sq. ft.
4109 S 400 W, Anderson, IN 46011
MLS# 22111186Listed by: F.C. TUCKER/PROSPERITY $139,900Active3 beds 1 baths1,132 sq. ft.
208 E 35th Street, Anderson, IN 46013
MLS# 22111260Listed by: KELLER WILLIAMS INDY METRO NE $75,900Pending2 beds 1 baths768 sq. ft.
4120 Delaware Street, Anderson, IN 46013
MLS# 22111189Listed by: RE/MAX REAL ESTATE SOLUTIONS $230,000Active2 beds 2 baths1,336 sq. ft.
3427 Village Drive, Anderson, IN 46011
MLS# 22111158Listed by: HODGES REALTY, LLC $68,900Active2 beds 1 baths948 sq. ft.
627 E 31st Street, Anderson, IN 46016
MLS# 22107181Listed by: F.C. TUCKER/PROSPERITY $229,000Pending3 beds 2 baths1,439 sq. ft.
1611 Charles Street, Anderson, IN 46013
MLS# 22110418Listed by: WEIGHTMAN REALTY GROUP, LLC $229,900Active3 beds 1 baths1,157 sq. ft.
2705 W 38th Street, Anderson, IN 46011
MLS# 22110046Listed by: BOARDWALK REALTY, LLC $90,000Pending3 beds 1 baths1,131 sq. ft.
2403 Bramble Way, Anderson, IN 46011
MLS# 22106336Listed by: AMR REAL ESTATE LLC $395,000Pending4 beds 4 baths3,564 sq. ft.
720 Golf Club Road, Anderson, IN 46011
MLS# 22108049Listed by: EXP REALTY, LLC $164,900Active3 beds 1 baths1,274 sq. ft.
1619 Poplar Street, Anderson, IN 46012
MLS# 22110708Listed by: WEIGHTMAN REALTY GROUP, LLC $39,900Active2 beds 2 baths740 sq. ft.
1314 Fairfax Street, Anderson, IN 46012
MLS# 22110606Listed by: SHOUSE REALTY GROUP LLC $189,900Active3 beds 2 baths1,086 sq. ft.
1918 W Balsam Court, Anderson, IN 46011
MLS# 22110587Listed by: REMAX ONE $215,000Pending2 beds 1 baths1,932 sq. ft.
4524 Nichol Avenue, Anderson, IN 46011
MLS# 22110601Listed by: F.C. TUCKER COMPANY $122,000Active3 beds 2 baths1,365 sq. ft.
623 Ruddle Avenue, Anderson, IN 46012
MLS# 22105478Listed by: KELLER WILLIAMS INDY METRO NE $99,900Active2 beds 1 baths936 sq. ft.
2509 Lincoln Street, Anderson, IN 46016
MLS# 22110168Listed by: F.C. TUCKER COMPANY $165,000Pending3 beds 1 baths1,028 sq. ft.
3315 E 6th Street, Anderson, IN 46012
MLS# 22109657Listed by: RE/MAX REAL ESTATE SOLUTIONS $265,000Active3 beds 3 baths1,512 sq. ft.
5807 Columbus Avenue, Anderson, IN 46013
MLS# 22109993Listed by: RE/MAX REAL ESTATE SOLUTIONS $890,000Pending5 beds 6 baths6,274 sq. ft.
4083 W State Road 32, Anderson, IN 46011
MLS# 22108965Listed by: KELLER WILLIAMS INDY METRO NE $39,900Active-- beds -- baths
1411 Ohio Avenue, Anderson, IN 46016
MLS# 22109642Listed by: WEST & MAIN REAL ESTATE $294,900Active3 beds 2 baths1,596 sq. ft.
3748 Campbell Drive, Anderson, IN 46012
MLS# 22110127Listed by: RE/MAX REALTY ONE $158,000Pending2 beds 1 baths780 sq. ft.
2605 E 5th Street, Anderson, IN 46012
MLS# 22108593Listed by: BENNETT REALTY $254,900Active3 beds 2 baths1,632 sq. ft.
1403 Cottonwood Drive, Anderson, IN 46012
MLS# 22109702Listed by: RE/MAX REAL ESTATE SOLUTIONS $195,000Pending3 beds 2 baths1,452 sq. ft.
1741 Shepherd Road, Anderson, IN 46012
MLS# 22109410Listed by: BERKSHIRE HATHAWAY HOME $189,900Pending3 beds 2 baths1,362 sq. ft.
1408 E 42nd Street, Anderson, IN 46013
MLS# 22109850Listed by: KELLER WILLIAMS INDPLS METRO N $123,000Active3 beds 1 baths1,042 sq. ft.
618 W 22nd Street, Anderson, IN 46016
MLS# 22110238Listed by: INSPIRED REALTY $49,000Active3 beds 1 baths864 sq. ft.
2234 Silver Street, Anderson, IN 46012
MLS# 22110066Listed by: DIVERSE PROPERTY SOLUTIONS IND $229,900Active3 beds 2 baths1,340 sq. ft.
509 Imy Lane, Anderson, IN 46013
MLS# 22109876Listed by: RE/MAX REAL ESTATE SOLUTIONS $183,750Active3 beds 2 baths1,569 sq. ft.
4522 Columbus Avenue, Anderson, IN 46013
MLS# 22110115Listed by: REMAX ONE $94,900Active3 beds 1 baths1,008 sq. ft.
1016 E 29th Street, Anderson, IN 46016
MLS# 22110144Listed by: KELLER WILLIAMS INDY METRO NE $209,250Active4 beds 2 baths1,508 sq. ft.
3012 E 6th Street, Anderson, IN 46012
MLS# 22109707Listed by: RE/MAX REAL ESTATE SOLUTIONS $125,000Active3 beds 1 baths1,782 sq. ft.
1031 Hendricks Street, Anderson, IN 46016
MLS# 22045266Listed by: RE/MAX REAL ESTATE SOLUTIONS $249,900Active8.73 Acres
400 South Street, Anderson, IN 46017
MLS# 22110040Listed by: RE/MAX EDGE $268,000Active3 beds 2 baths1,373 sq. ft.
7411 Plantation Drive, Anderson, IN 46013
MLS# 22107825Listed by: KELLER WILLIAMS INDY METRO NE $102,000Active3 beds 1 baths1,372 sq. ft.
1229 W 7th Street, Anderson, IN 46016
MLS# 22109951Listed by: FISCHER REALTY, LLC $130,000Active2 beds 1 baths832 sq. ft.
3151 W 18th Street, Anderson, IN 46011
MLS# 22109682Listed by: TRIPLE E REALTY, LLC $115,000Active3 beds 2 baths2,690 sq. ft.
1631 W 14th Street, Anderson, IN 46016
MLS# 22109684Listed by: TRIPLE E REALTY, LLC $115,000Active3 beds 1 baths1,560 sq. ft.
1024 W 13th Street, Anderson, IN 46016
MLS# 22109686Listed by: TRIPLE E REALTY, LLC $75,000Active1 beds 1 baths496 sq. ft.
304 Andover Road, Anderson, IN 46013
MLS# 22109639Listed by: GOLDEN RULE REALTY, LLC $195,000Active-- beds -- baths
2417 Pearl Street, Anderson, IN 46016
MLS# 22109542Listed by: REALTY WEALTH ADVISORS $1,900,000Active18.71 Acres
3125 Doctor Mlk Jr Boulevard, Anderson, IN 46016
MLS# 202624519Listed by: BLUE FLAG REALTY INC $187,900Active3 beds 1 baths1,268 sq. ft.
2011 Rosewood Avenue, Anderson, IN 46011
MLS# 22109459Listed by: EXP REALTY LLC $139,900Active3 beds 1 baths1,319 sq. ft.
1408 W 13th Street, Anderson, IN 46016
MLS# 22109227Listed by: REALTY WEALTH ADVISORS $224,900Pending3 beds 3 baths1,811 sq. ft.
2526 Albert Street, Anderson, IN 46012
MLS# 22109257Listed by: RED BRIDGE REAL ESTATE $145,000Active3 beds 2 baths1,402 sq. ft.
321 Milton, Anderson, IN 46012
MLS# 22108526Listed by: HIGHGARDEN REAL ESTATE $230,000Active3 beds 2 baths1,840 sq. ft.
2217 Melody Lane, Anderson, IN 46012
MLS# 22108692Listed by: KELLER WILLIAMS INDY METRO NE $46,900Active2 beds 1 baths742 sq. ft.
2220 Euclid Drive, Anderson, IN 46011
MLS# 202624128Listed by: KMD REAL ESTATE LLC $34,900Active2 beds 1 baths987 sq. ft.
1415 Nichol Avenue, Anderson, IN 46016
MLS# 202624132Listed by: KMD REAL ESTATE LLC $199,900Pending3 beds 2 baths1,306 sq. ft.
724 Hillside Drive, Anderson, IN 46012
MLS# 22109082Listed by: GREEN FOREST REALTY $62,900Active2 beds 1 baths720 sq. ft.
1716 Dewey Street, Anderson, IN 46016
MLS# 202624125Listed by: KMD REAL ESTATE LLC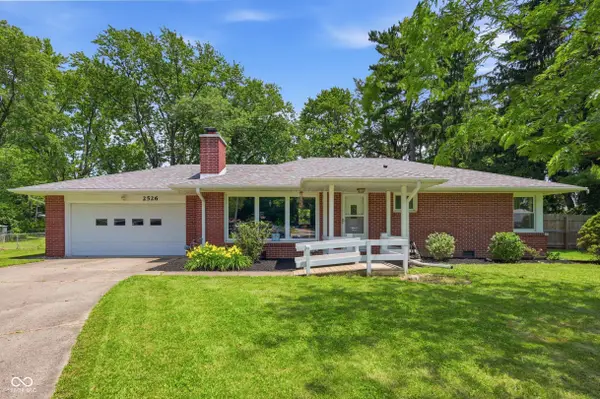 $169,900Pending3 beds 1 baths1,218 sq. ft.
2526 Thayer Court, Anderson, IN 46011
MLS# 22107855Listed by: F.C. TUCKER COMPANY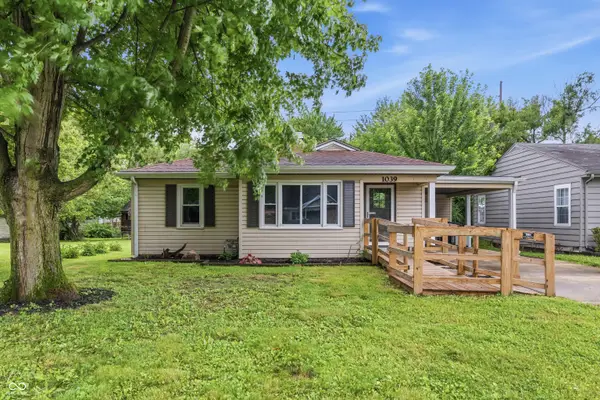 $137,900Pending2 beds 1 baths880 sq. ft.
1039 Fairfax Street, Anderson, IN 46012
MLS# 22108613Listed by: PILLARIO PROPERTY MANAGEMENT LLC $72,000Active4 beds 1 baths2,344 sq. ft.
1324 W 1st Street, Anderson, IN 46016
MLS# 22108730Listed by: RE/MAX REAL ESTATE SOLUTIONS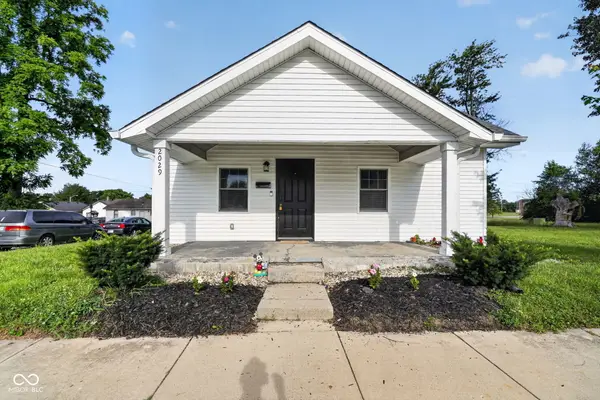 $119,900Active3 beds 1 baths896 sq. ft.
2029 Hendricks Street, Anderson, IN 46016
MLS# 22106595Listed by: TRUEBLOOD REAL ESTATE $204,900Active3 beds 2 baths1,212 sq. ft.
6018 Rocky Road, Anderson, IN 46013
MLS# 22107662Listed by: TRUEBLOOD REAL ESTATE $220,000Pending3 beds 2 baths1,202 sq. ft.
719 S Rangeline Road, Anderson, IN 46012
MLS# 22108018Listed by: EXP REALTY, LLC $149,000Active4 beds 2 baths1,855 sq. ft.
674 W 300 N, Anderson, IN 46011
MLS# 22108875Listed by: DIVERSE PROPERTY SOLUTIONS IND $198,500Pending2 beds 1 baths1,208 sq. ft.
2245 E County Road 67, Anderson, IN 46017
MLS# 202623847Listed by: PROPERTY HOUSE $650,000Active4 beds 4 baths3,087 sq. ft.
2928 Alexandria Pike, Anderson, IN 46012
MLS# 22108165Listed by: CARPENTER, REALTORS $149,900Active4 beds 1 baths1,225 sq. ft.
1705 Woodbine Drive, Anderson, IN 46011
MLS# 22108675Listed by: RED BRIDGE REAL ESTATE $439,900Active5 beds 4 baths3,062 sq. ft.
1567 Henry Street, Fortville, IN 46040
MLS# 22108722Listed by: DRH REALTY OF INDIANA, LLC $402,790Active4 beds 3 baths2,278 sq. ft.
1591 Henry Street, Fortville, IN 46040
MLS# 22108734Listed by: DRH REALTY OF INDIANA, LLC $129,900Active2 beds 1 baths917 sq. ft.
1707 W 8th Street, Anderson, IN 46016
MLS# 22108185Listed by: NEXTHOME ELITE REAL ESTATE $310,000Pending5 beds 4 baths2,420 sq. ft.
4349 Alhambra Drive, Anderson, IN 46013
MLS# 22108385Listed by: EVER REAL ESTATE, LLC $69,900Active2 beds 1 baths823 sq. ft.
2005 Euclid Drive, Anderson, IN 46011
MLS# 22108317Listed by: OLYMPUS REALTY GROUP $5,500Active0.15 Acres
1903 Walton Street, Anderson, IN 46016
MLS# 202623282Listed by: RE/MAX REVOLUTION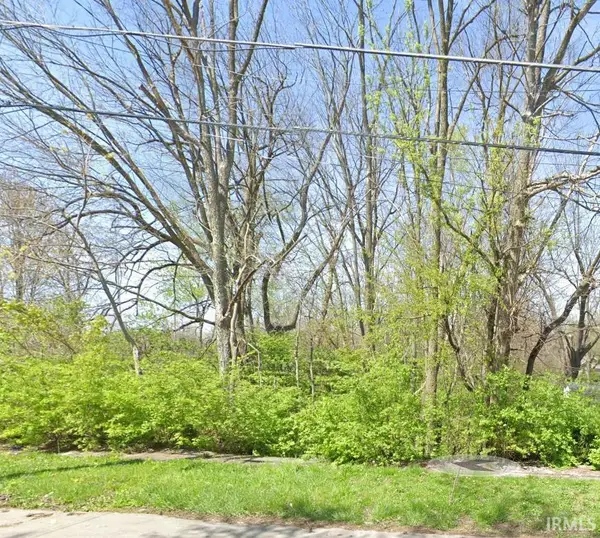 $5,500Active0.13 Acres
2340 W Ninth Street, Anderson, IN 46016
MLS# 202623283Listed by: RE/MAX REVOLUTION $243,900Active3 beds 2 baths1,536 sq. ft.
3293 E 100 S, Anderson, IN 46017
MLS# 22107324Listed by: RE/MAX REAL ESTATE SOLUTIONS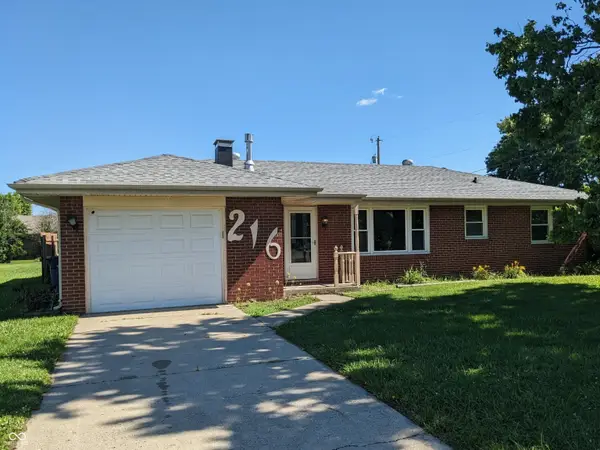 $200,000Active3 beds 2 baths1,160 sq. ft.
216 E 49th Street, Anderson, IN 46013
MLS# 22107860Listed by: 1 PERCENT LISTS INDIANA REAL ESTATE $259,900Pending4 beds 3 baths2,292 sq. ft.
3128 W 13th Street, Anderson, IN 46011
MLS# 22105791Listed by: F.C. TUCKER/PROSPERITY $174,900Pending2 beds 3 baths1,483 sq. ft.
4406 Dartmouth Drive, Anderson, IN 46013
MLS# 22106663Listed by: RE/MAX REAL ESTATE SOLUTIONS $279,900Pending4 beds 3 baths1,998 sq. ft.
1829 Edward Lane, Anderson, IN 46012
MLS# 22107725Listed by: NEXTHOME ELITE REAL ESTATE $179,900Pending3 beds 2 baths1,234 sq. ft.
1523 Northcrest Drive, Anderson, IN 46012
MLS# 202622850Listed by: GREEN FOREST REALTY $149,900Active3 beds 1 baths936 sq. ft.
2742 W 18th Street, Anderson, IN 46011
MLS# 22107652Listed by: REMAX ONE $174,900Pending3 beds 2 baths1,054 sq. ft.
3109 Poplar Street, Anderson, IN 46012
MLS# 22107718Listed by: RED BRIDGE REAL ESTATE $109,900Active2 beds 1 baths682 sq. ft.
1815 Fulton Street, Anderson, IN 46016
MLS# 22107628Listed by: REALTY WEALTH ADVISORS $105,000Active3 beds 2 baths1,596 sq. ft.
2105 Arrow Avenue, Anderson, IN 46016
MLS# 22107393Listed by: PILLARIO PROPERTY MANAGEMENT LLC $239,900Active4 beds 2 baths1,654 sq. ft.
515 Hawthorne Avenue, Anderson, IN 46011
MLS# 22107395Listed by: RE/MAX REAL ESTATE SOLUTIONS $160,000Pending3 beds 2 baths1,594 sq. ft.
3214 Chapel Road, Anderson, IN 46012
MLS# 22107448Listed by: CARPENTER, REALTORS $209,900Active3 beds 2 baths1,288 sq. ft.
5218 Fletcher Street, Anderson, IN 46013
MLS# 22103253Listed by: EXP REALTY, LLC $149,900Active3 beds 2 baths1,285 sq. ft.
1217 W 3rd Street, Anderson, IN 47304
MLS# 202622614Listed by: NEXTHOME ELITE REAL ESTATE $319,900Active4 beds 4 baths3,496 sq. ft.
3117 Wayside Lane, Anderson, IN 46011
MLS# 22105789Listed by: RE/MAX REAL ESTATE SOLUTIONS $109,900Active2 beds 1 baths760 sq. ft.
607 Ellenhurst Drive, Anderson, IN 46012
MLS# 22107067Listed by: KELLER WILLIAMS INDY METRO NE $139,900Active3 beds 2 baths1,328 sq. ft.
2410 Central Avenue, Anderson, IN 46016
MLS# 202622210Listed by: RE/MAX REAL ESTATE GROUPS $260,000Active3 beds 2 baths1,843 sq. ft.
616 Vermillion Court, Anderson, IN 46012
MLS# 22106859Listed by: RE/MAX ADVANCED REALTY $250,000Active3 beds 3 baths1,898 sq. ft.
2828 Rand Lane, Anderson, IN 46013
MLS# 22106679Listed by: WELCOME HOME INDIANA LLC $129,900Active4 beds 2 baths1,519 sq. ft.
816 Chestnut Street, Anderson, IN 46012
MLS# 22101062Listed by: RIGHT HOME REALTY LLC $299,900Pending3 beds 2 baths1,740 sq. ft.
2580 Tod, Anderson, IN 46013
MLS# 22106040Listed by: REMAX ONE $215,000Active4 beds 2 baths1,664 sq. ft.
910 Heritage Lane, Anderson, IN 46013
MLS# 22106601Listed by: F.C. TUCKER/PROSPERITY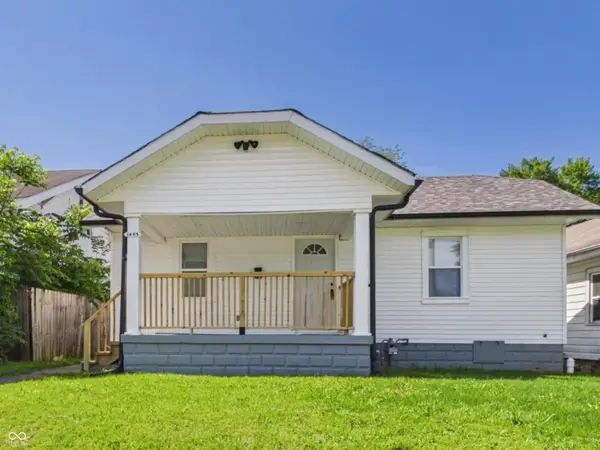 $135,000Active3 beds 2 baths1,221 sq. ft.
1403 W 3rd Street, Anderson, IN 46016
MLS# 22106205Listed by: RE/MAX REAL ESTATE SOLUTIONS $175,000Active3 beds 1 baths1,050 sq. ft.
8 S Scatterfield Road, Anderson, IN 46012
MLS# 22106213Listed by: KELLER WILLIAMS INDY METRO NE $161,000Active3 beds 2 baths1,246 sq. ft.
1515 Pearl Street, Anderson, IN 46016
MLS# 22106418Listed by: EPIQUE INC $148,500Active4 beds 2 baths1,863 sq. ft.
810 College, Anderson, IN 46012
MLS# 22106077Listed by: F.C. TUCKER/PROSPERITY $175,000Pending2 beds 2 baths1,052 sq. ft.
4719 Gleneagle Drive #22B, Anderson, IN 46013
MLS# 22106448Listed by: RE/MAX REAL ESTATE SOLUTIONS $242,000Active3 beds 2 baths1,698 sq. ft.
2908 Taxus Street, Anderson, IN 46011
MLS# 22106295Listed by: KENTER REAL ESTATE, LLC $280,000Active3 beds 2 baths1,964 sq. ft.
1641 Hillcrest Avenue, Anderson, IN 46011
MLS# 22105911Listed by: KELLER WILLIAMS INDY METRO NE $249,900Pending3 beds 3 baths3,640 sq. ft.
2226 Lake Drive, Anderson, IN 46012
MLS# 22105334Listed by: F.C. TUCKER COMPANY $169,500Active3 beds 2 baths2,151 sq. ft.
4512 Columbus Avenue, Anderson, IN 46013
MLS# 22106144Listed by: HIGHGARDEN REAL ESTATE $325,000Pending-- beds -- baths
2701 E 8th Street, Anderson, IN 46012
MLS# 22105852Listed by: EXP REALTY, LLC $114,500Pending3 beds 2 baths872 sq. ft.
2636 Central Avenue, Anderson, IN 46016
MLS# 22106063Listed by: RE/MAX REAL ESTATE SOLUTIONS $219,000Active1 Acres
1402 S Madison, Anderson, IN 46016
MLS# 22106078Listed by: EXP REALTY, LLC $800,000Active4 beds 6 baths8,605 sq. ft.
812 Woodcrest Way, Anderson, IN 46012
MLS# 22105031Listed by: EXP REALTY, LLC $235,000Active4 beds 2 baths2,016 sq. ft.
1517 E 43rd Street, Anderson, IN 46013
MLS# 22105760Listed by: F.C. TUCKER COMPANY $75,000Active0.99 Acres
0 Lindberg Road, Anderson, IN 46012
MLS# 22105461Listed by: HIGHGARDEN REAL ESTATE $139,000Active-- beds -- baths
131 W 13th Street, Anderson, IN 46016
MLS# 22105747Listed by: INSPIRED REALTY $180,000Active-- beds -- baths
1732 Noble Street, Anderson, IN 46016
MLS# 22105748Listed by: INSPIRED REALTY $26,900Active0.32 Acres
0 Hanover, Anderson, IN 46012
MLS# 22105231Listed by: F.C. TUCKER/PROSPERITY $64,900Active2 beds 1 baths810 sq. ft.
705 E 27th Street, Anderson, IN 46016
MLS# 22105407Listed by: RE/MAX REAL ESTATE SOLUTIONS $56,000Active1.1 Acres
4079 W State Road 32, Anderson, IN 46011
MLS# 22104879Listed by: HIGHGARDEN REAL ESTATE $110,000Active2 beds 1 baths879 sq. ft.
201 E 38th Street, Anderson, IN 46013
MLS# 22105419Listed by: RE/MAX REAL ESTATE SOLUTIONS $150,000Pending3 beds 1 baths875 sq. ft.
2705 Crystal Street, Anderson, IN 46012
MLS# 22104305Listed by: REMAX ONE $259,900Pending3 beds 2 baths1,938 sq. ft.
812 Eastgate Drive, Anderson, IN 46012
MLS# 22104647Listed by: REMAX ONE $234,900Active3 beds 2 baths1,388 sq. ft.
3403 Debra Drive, Anderson, IN 46012
MLS# 22104896Listed by: RE/MAX REAL ESTATE SOLUTIONS $132,050Active3 beds 1 baths1,204 sq. ft.
611 Chestnut Street, Anderson, IN 46012
MLS# 22105027Listed by: WILMOTH GROUP $285,000Active4 beds 3 baths2,053 sq. ft.
3210 Wayside Lane, Anderson, IN 46011
MLS# 22104886Listed by: UNITED REAL ESTATE INDPLS $59,900Pending3 beds 1 baths1,512 sq. ft.
2629 E Lynn Street, Anderson, IN 46016
MLS# 22104842Listed by: WEIGHTMAN REALTY GROUP, LLC $149,900Active3 beds 1 baths912 sq. ft.
1720 Johnson Avenue, Anderson, IN 46016
MLS# 22104450Listed by: RE/MAX COMPLETE $54,900Active2 beds 1 baths1,320 sq. ft.
1721 Pearl Street, Anderson, IN 46016
MLS# 22103822Listed by: LIST WITH BEN, LLC $220,000Active3 beds 2 baths1,375 sq. ft.
2721 Marsha Drive, Anderson, IN 46012
MLS# 22104002Listed by: HOME BOUND REAL ESTATE LLC $375,000Pending-- beds -- baths
714 W Cross Street, Anderson, IN 46011
MLS# 22098971Listed by: RE/MAX COMPLETE $345,000Active5 beds 3 baths3,024 sq. ft.
412 W 11th Street, Anderson, IN 46016
MLS# 22104009Listed by: HOME BOUND REAL ESTATE LLC $150,000Active12.47 Acres
0 W Cross Street, Anderson, IN 46012
MLS# 22102375Listed by: EXP REALTY, LLC $200,000Pending3 beds 2 baths1,730 sq. ft.
4405 S 50 W, Anderson, IN 46013
MLS# 22102557Listed by: COMPASS INDIANA, LLC $253,900Active3 beds 3 baths3,104 sq. ft.
826 Yorkshire Road, Anderson, IN 46012
MLS# 22103895Listed by: KELLER WILLIAMS INDY METRO PARTNERS $40,000Active0.22 Acres
0 W 39th Street W, Anderson, IN 46013
MLS# 22103803Listed by: RE/MAX REAL ESTATE SOLUTIONS $6,490Active0.04 Acres
327 S Madison Avenue, Anderson, IN 46016
MLS# 22103733Listed by: KELLER WILLIAMS INDY METRO PARTNERS $230,000Pending3 beds 2 baths1,289 sq. ft.
3180 S 200 E, Anderson, IN 46017
MLS# 22103461Listed by: RE/MAX REAL ESTATE SOLUTIONS $225,000Active5 beds 2 baths4,892 sq. ft.
320 W 12th Street, Anderson, IN 46016
MLS# 22103699Listed by: INDIANA FORD REALTY LLC $248,500Active2 beds 2 baths1,575 sq. ft.
3711 Ironwood Place, Anderson, IN 46011
MLS# 22102760Listed by: KELLER WILLIAMS INDY METRO NE $228,000Active3 beds 2 baths1,392 sq. ft.
4620 Southview Drive, Anderson, IN 46013
MLS# 22103278Listed by: RE/MAX REAL ESTATE SOLUTIONS $75,900Active2 beds 1 baths972 sq. ft.
1605 Hill Street, Anderson, IN 46012
MLS# 202619376Listed by: LIST WITH BEN, LLC $87,900Pending-- beds -- baths
1308-1310 Cincinnati Avenue, Anderson, IN 46016
MLS# 22102407Listed by: RE/MAX REAL ESTATE SOLUTIONS $239,000Pending2 beds 2 baths1,650 sq. ft.
1172 N 200 E, Anderson, IN 46012
MLS# 22103084Listed by: EXP REALTY, LLC $199,900Pending3 beds 2 baths1,584 sq. ft.
2333 Windmire Way, Anderson, IN 46012
MLS# 22097065Listed by: EXP REALTY LLC $134,900Active3 beds 1 baths977 sq. ft.
911 Washington Boulevard, Anderson, IN 46016
MLS# 22102617Listed by: PILLARIO PROPERTY MANAGEMENT LLC $89,900Pending2 beds 1 baths968 sq. ft.
1214 E 28th Street, Anderson, IN 46016
MLS# 202619076Listed by: RE/MAX ANEW REALTY $287,900Active3 beds 2 baths1,527 sq. ft.
339 W 2nd Street, Anderson, IN 46016
MLS# 22102960Listed by: STARR REAL ESTATE LLC $90,249Active2 beds 1 baths1,079 sq. ft.
143 E School Street, Anderson, IN 46012
MLS# 22102975Listed by: FC TUCKER RICHMOND $125,000Pending2 beds 1 baths1,324 sq. ft.
4212 Columbus Avenue, Anderson, IN 46013
MLS# 22102196Listed by: RE/MAX REAL ESTATE SOLUTIONS $280,000Active2 beds 2 baths1,854 sq. ft.
133 Asbury Drive, Anderson, IN 46013
MLS# 22101294Listed by: RE/MAX REAL ESTATE SOLUTIONS $144,900Active5 beds 2 baths1,619 sq. ft.
1125 E 8th Street, Anderson, IN 46012
MLS# 22102615Listed by: GREEN FOREST REALTY $44,900Active3 beds 1 baths1,234 sq. ft.
1528 W 20th Street, Anderson, IN 46016
MLS# 22102578Listed by: REALTY WEALTH ADVISORS $118,000Pending2 beds 1 baths768 sq. ft.
2809 Taxus Street, Anderson, IN 46011
MLS# 22101935Listed by: HIGHGARDEN REAL ESTATE $42,000Active3 beds 2 baths1,613 sq. ft.
2703 Main Street, Anderson, IN 46016
MLS# 22102428Listed by: AMR REAL ESTATE LLC $169,900Pending4 beds 2 baths1,275 sq. ft.
1426 Sherman Street, Anderson, IN 46016
MLS# 22100249Listed by: RE/MAX REAL ESTATE SOLUTIONS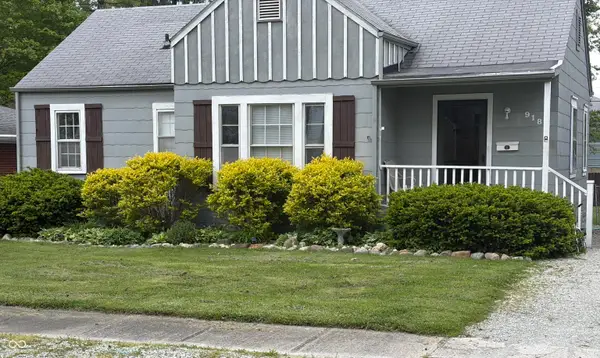 $172,900Active4 beds 2 baths1,638 sq. ft.
918 Maplewood Avenue, Anderson, IN 46012
MLS# 22102482Listed by: BEYCOME BROKERAGE REALTY LLC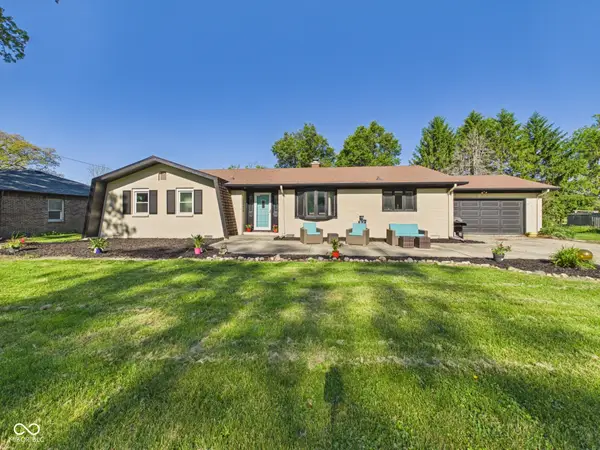 $226,900Pending3 beds 3 baths1,795 sq. ft.
3929 Haven Place, Anderson, IN 46011
MLS# 22101591Listed by: RE/MAX REAL ESTATE SOLUTIONS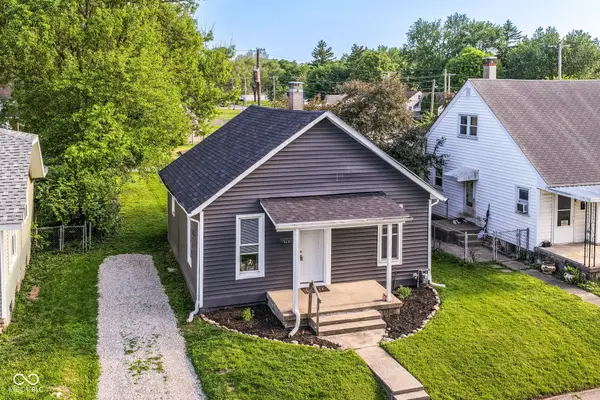
 $105,000Active2 beds 1 baths861 sq. ft.
1525 W 5th Street, Anderson, IN 46016
MLS# 22101713Listed by: CENTURY 21 SCHEETZ $300,000Active3 beds 3 baths1,521 sq. ft.
5312 Larita Lane, Anderson, IN 46017
MLS# 22098895Listed by: EXP REALTY, LLC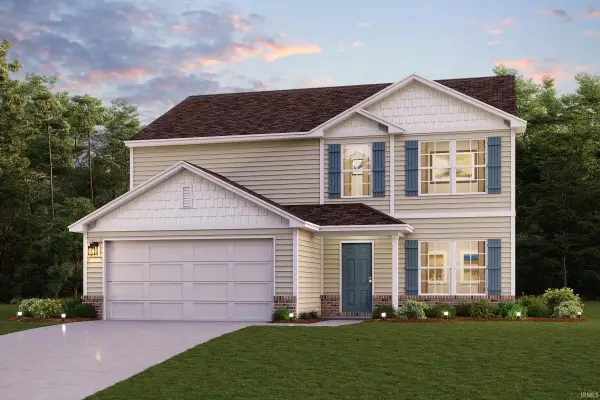 $301,990Pending5 beds 3 baths2,180 sq. ft.
2082 Derby Way, Memphis, IN 47143
MLS# 202618271Listed by: WJH BROKERAGE IN, LLC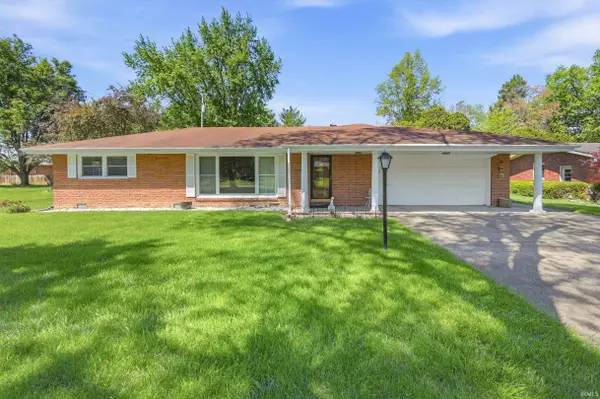 $150,000Pending2 beds 2 baths1,302 sq. ft.
705 Oxford Road, Anderson, IN 46012
MLS# 202618222Listed by: NEXTHOME ELITE REAL ESTATE $225,000Active3 beds 2 baths2,125 sq. ft.
3426 W 8th Street, Anderson, IN 46011
MLS# 22101742Listed by: CARPENTER, REALTORS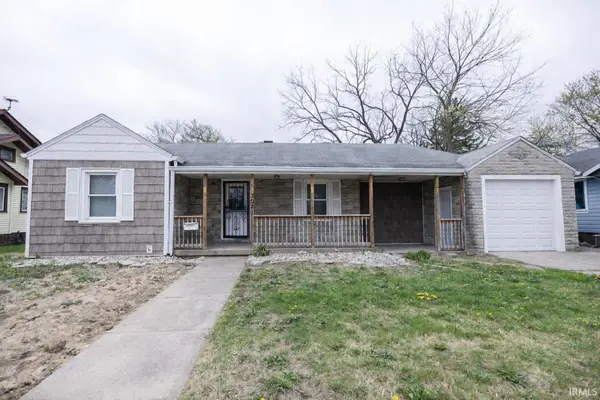 $164,900Active3 beds 2 baths1,432 sq. ft.
3021 Columbus Avenue, Anderson, IN 46016
MLS# 202618152Listed by: NEXTHOME ELITE REAL ESTATE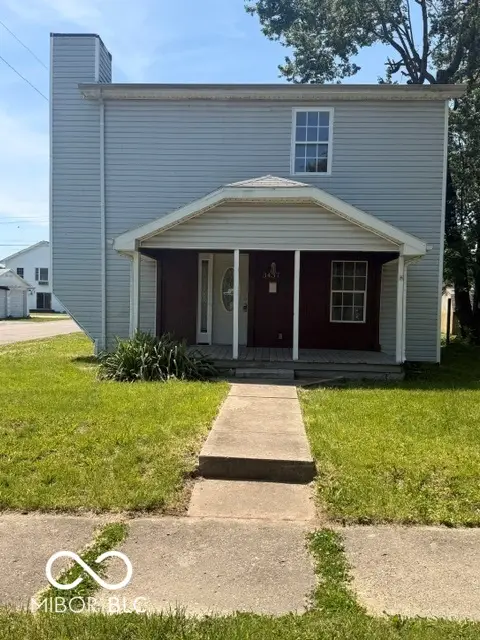 $79,900Active3 beds 1 baths1,464 sq. ft.
3437 Hamilton Place, Anderson, IN 46013
MLS# 22100456Listed by: KELLER WILLIAMS INDPLS METRO N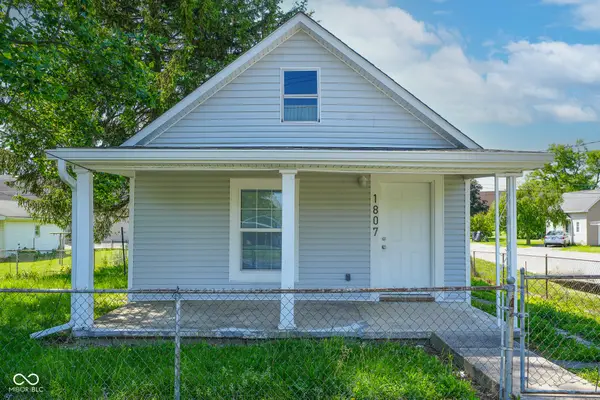 $129,900Active3 beds 1 baths930 sq. ft.
1807 E 18th Street, Anderson, IN 46016
MLS# 22101769Listed by: REALTY WEALTH ADVISORS- Open Sat, 1 to 3pm
 $358,900Active4 beds 4 baths3,463 sq. ft.
915 Edgehill Lane, Anderson, IN 46012
MLS# 22101662Listed by: TAFLINGER REAL ESTATE GROUP 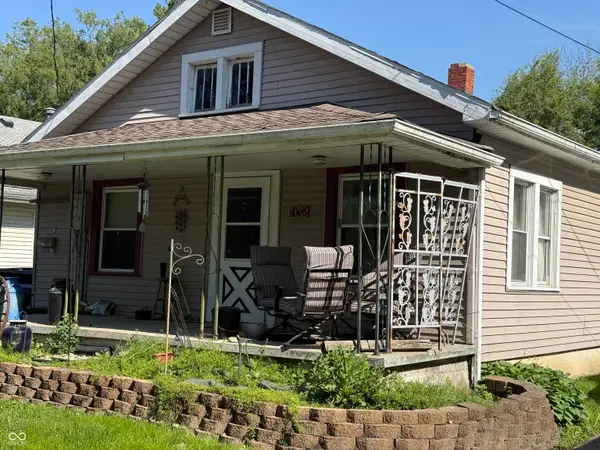 $65,000Pending3 beds 1 baths1,346 sq. ft.
1132 Manor Court, Anderson, IN 46016
MLS# 22101532Listed by: RE/MAX COMPLETE $699,900Active29.93 Acres
0 Sr 9, Anderson, IN 46012
MLS# 22099490Listed by: F.C. TUCKER COMPANY $144,900Pending4 beds 2 baths2,004 sq. ft.
3001 Nichol Avenue, Anderson, IN 46011
MLS# 22101303Listed by: LIST WITH BEN, LLC $94,899Active3 beds 1 baths1,640 sq. ft.
2334 Poplar Street, Anderson, IN 46012
MLS# 22101234Listed by: FC TUCKER RICHMOND $99,900Active2 beds 1 baths1,064 sq. ft.
3006 Noble Street, Anderson, IN 46016
MLS# 22101096Listed by: WILMOTH GROUP $325,000Pending-- beds -- baths
301 W 6th Street, Anderson, IN 46016
MLS# 22100787Listed by: PRESTIGE SVA GROUP INC $119,000Active3 beds 2 baths1,840 sq. ft.
239 W 38th Street, Anderson, IN 46013
MLS# 202617366Listed by: F.C. TUCKER/CROSSROADS REAL ESTATE $318,000Active4 beds 3 baths2,258 sq. ft.
816 Westgate Drive, Anderson, IN 46012
MLS# 22100488Listed by: EXP REALTY, LLC $209,000Active4 beds 2 baths1,639 sq. ft.
1908 Lora Street, Anderson, IN 46013
MLS# 22100660Listed by: KELLER WILLIAMS INDY METRO NE $240,000Active-- beds -- baths
2219 Fletcher Street, Anderson, IN 46016
MLS# 22098774Listed by: HORIZON REALTY GROUP LLC $6,000Active0.12 Acres
212 Clifford Street, Anderson, IN 46012
MLS# 202616943Listed by: EXP REALTY, LLC $119,700Pending3 beds 1 baths1,590 sq. ft.
1324 W 4th Street, Anderson, IN 46016
MLS# 22100440Listed by: EPIQUE INC $74,900Pending2 beds 1 baths840 sq. ft.
2507 E 5th Street, Anderson, IN 46012
MLS# 22100395Listed by: RE/MAX REAL ESTATE SOLUTIONS $89,000Active4 beds 2 baths2,464 sq. ft.
2821 Morton Street, Anderson, IN 46016
MLS# 22100155Listed by: RE/MAX ADVANCED REALTY
Local realty services provided by:CENTURY 21 Scheetz, CENTURY 21 Affiliated, CENTURY 21 River Valley Real Estate, Inc.
IRMLS information is provided exclusively for consumers' personal, non-commercial use and may not be used for any purpose other than to identify prospective properties consumers may be interested in purchasing. IRMLS Data is deemed reliable but is not guaranteed accurate by the MLS. IRMLS information provided by the Indiana Regional MLS. Copyright 2026 Indiana Regional MLS LLC. IN_LBAR Member Broker: Geri Rose
Neighborhoods near Anderson, IN
Zip codes near Anderson, IN
- 46001 homes for sale
- 46011 homes for sale
- 46012 homes for sale
- 46013 homes for sale
- 46016 homes for sale
- 46017 homes for sale
- 46040 homes for sale
- 46044 homes for sale
- 46048 homes for sale
- 46051 homes for sale
- 46056 homes for sale
- 46060 homes for sale
- 46064 homes for sale
- 46186 homes for sale
- 47304 homes for sale
- 47334 homes for sale
- 47356 homes for sale
- 47384 homes for sale
- 47388 homes for sale
- 47396 homes for sale
Popular searches near Anderson, IN
- Adams homes for sale
- Alexandria homes for sale
- Chesterfield homes for sale
- Daleville homes for sale
- Edgewood homes for sale
- Fall Creek homes for sale
- Fall Creek homes for sale
- Frankton homes for sale
- Green homes for sale
- Ingalls homes for sale
- Lafayette homes for sale
- Lapel homes for sale
- Markleville homes for sale
- Middletown homes for sale
- Pendleton homes for sale
- Richland homes for sale
- Salem homes for sale
- Stony Creek homes for sale
- Union homes for sale
- Yorktown homes for sale
Protect your home and budget from life's surprises with an Assurant Home Warranty, backed by a partner that supports you through every step of homeownership. Explore Plans.
©2026 Century 21 Real Estate LLC. All rights reserved. CENTURY 21®, the CENTURY 21 Logo and C21® are service marks owned by Century 21 Real Estate LLC. Century 21 Real Estate LLC fully supports the principles of the Fair Housing Act and the Equal Opportunity Act. Each office is independently owned and operated. Listing information is deemed reliable but not guaranteed accurate.